Trading
Made
Simple
For Traders
By Traders
$9.95/week after the
7-day trial unless
cancelled.
Cancel anytime.
Real-time momentum forecasts that update on the current candle, lock at close, and never repaint. Every forecast is logged — win or lose.
Trading involves risk, and you may lose some or all of your investment. These tools are for informational purposes only and do not constitute investment advice.
Want To Know More?
This is Predator.
Illustrative only — past performance does not guarantee future results.
$9.95/week after the
7-day trial unless
cancelled.
Cancel anytime.
#1
Logic
LOGIC — this is the engine stack all our indicators are based on. This is the core of our system and is built from dozens of mathematical engines and advanced logic. It is focused on current candle direction and momentum.
Illustrative only — past performance does not guarantee future results.
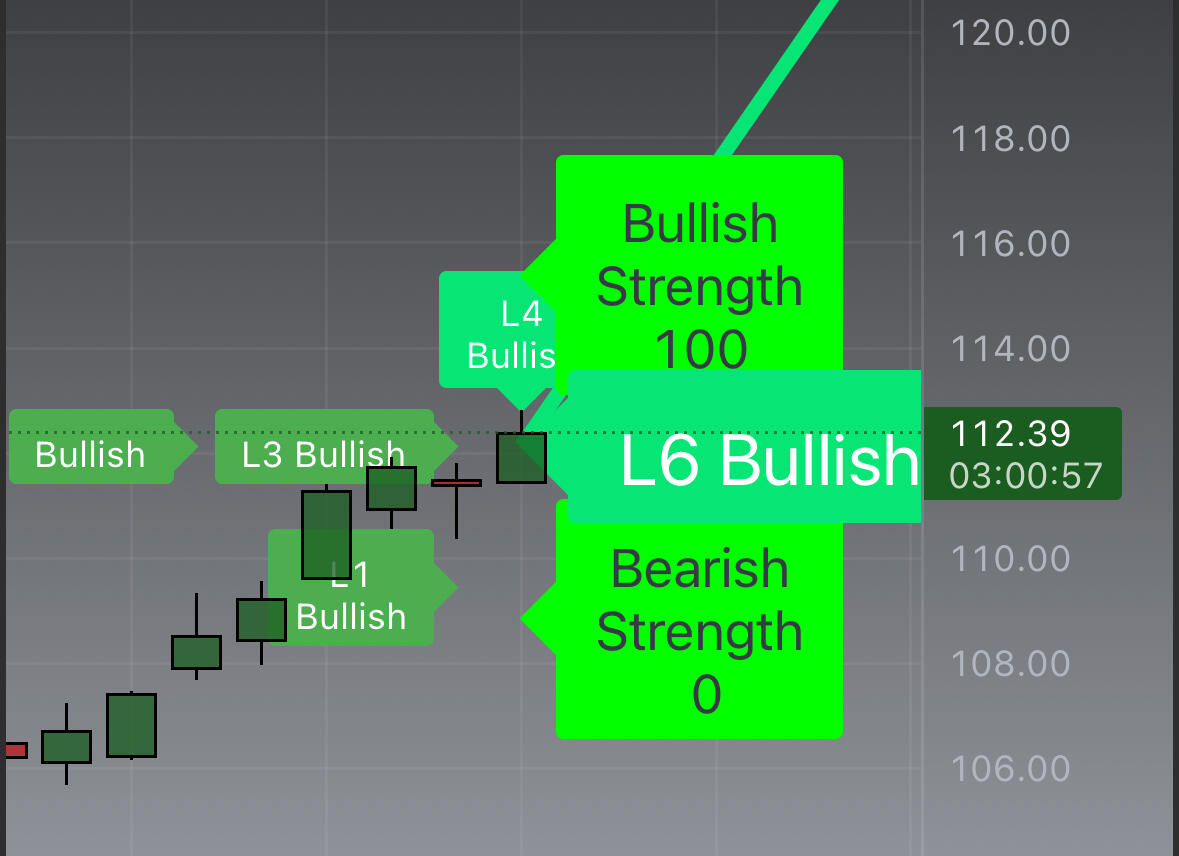
#2Forecasts
FORECASTS — all of the information gathered from LOGIC distilled into a few simple forecast markers with contextual support and resistance levels.
Illustrative only — past performance does not guarantee future results.
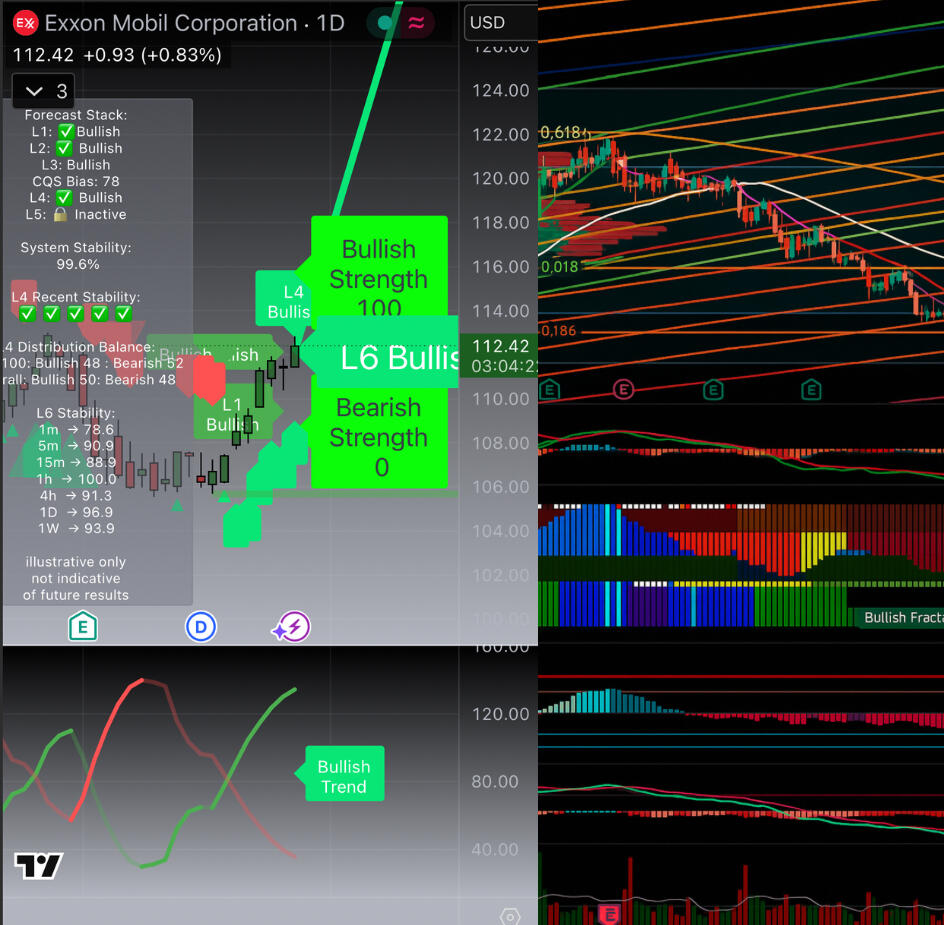
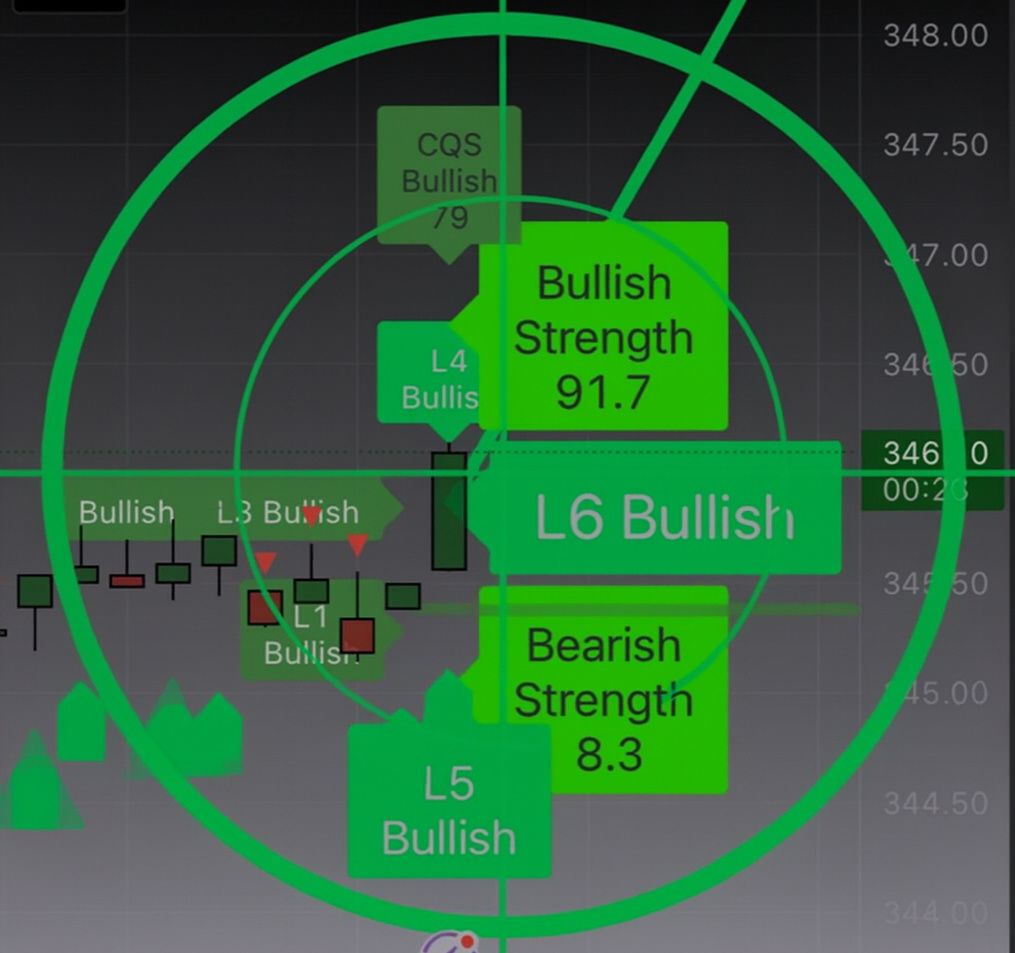
#3 MTF Momentum
MTF MOMENTUM — thos is our newest Indicator, a breakthrough tool designed to bring clarity and simplicity to complex market analysis. By blending data from LOGIC, Bull-Bear Pressure, and Forecast layers, it delivers a streamlined multi-timeframe interface that helps traders view market dynamics from multiple perspectives at once. Instead of juggling separate tools, users can now experience a single, cohesive display that highlights shifts in momentum across different time horizons.
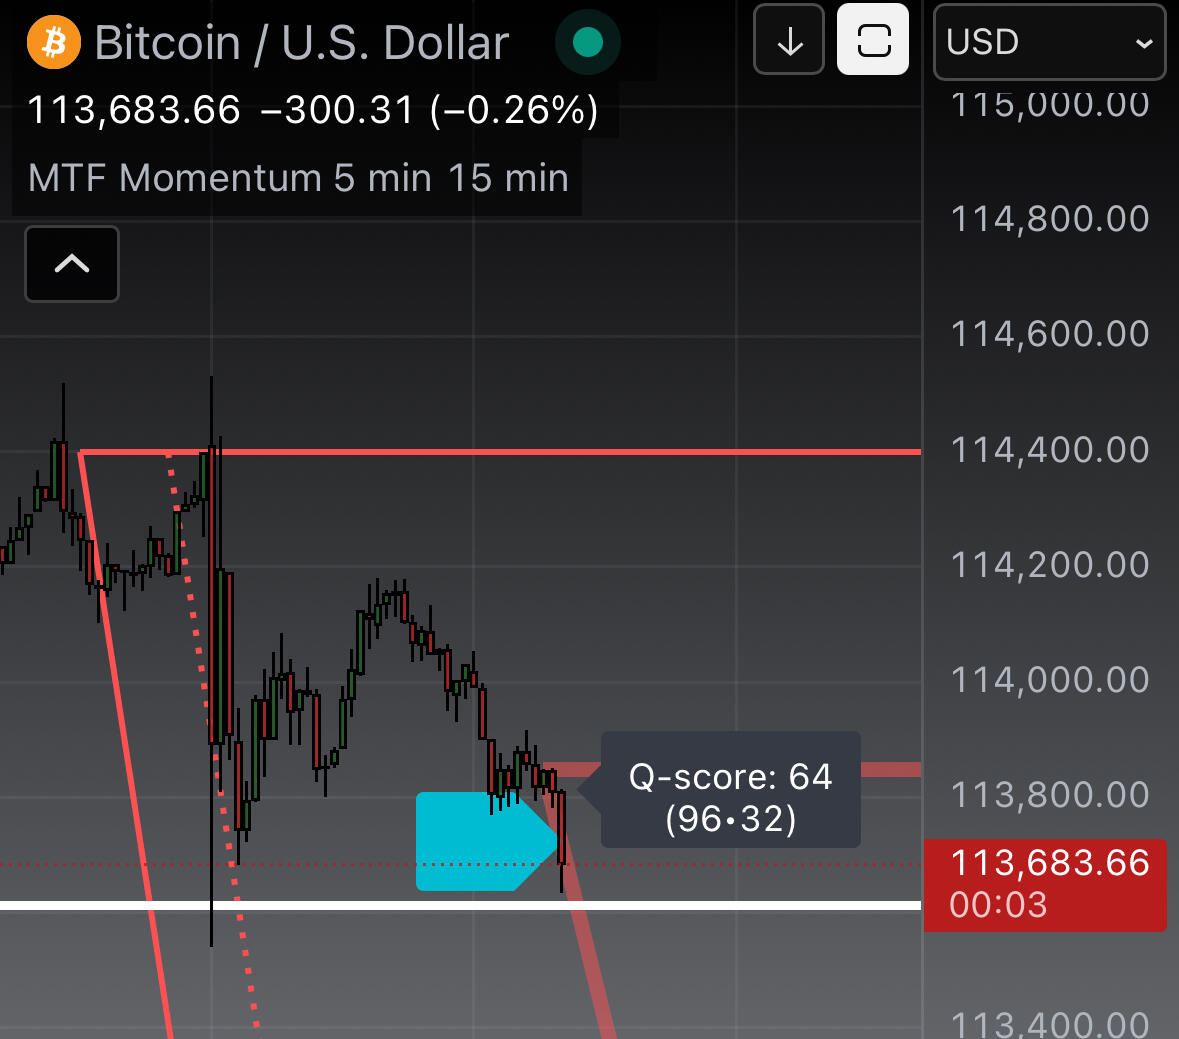
Illustrative only — past performance does not guarantee future results.
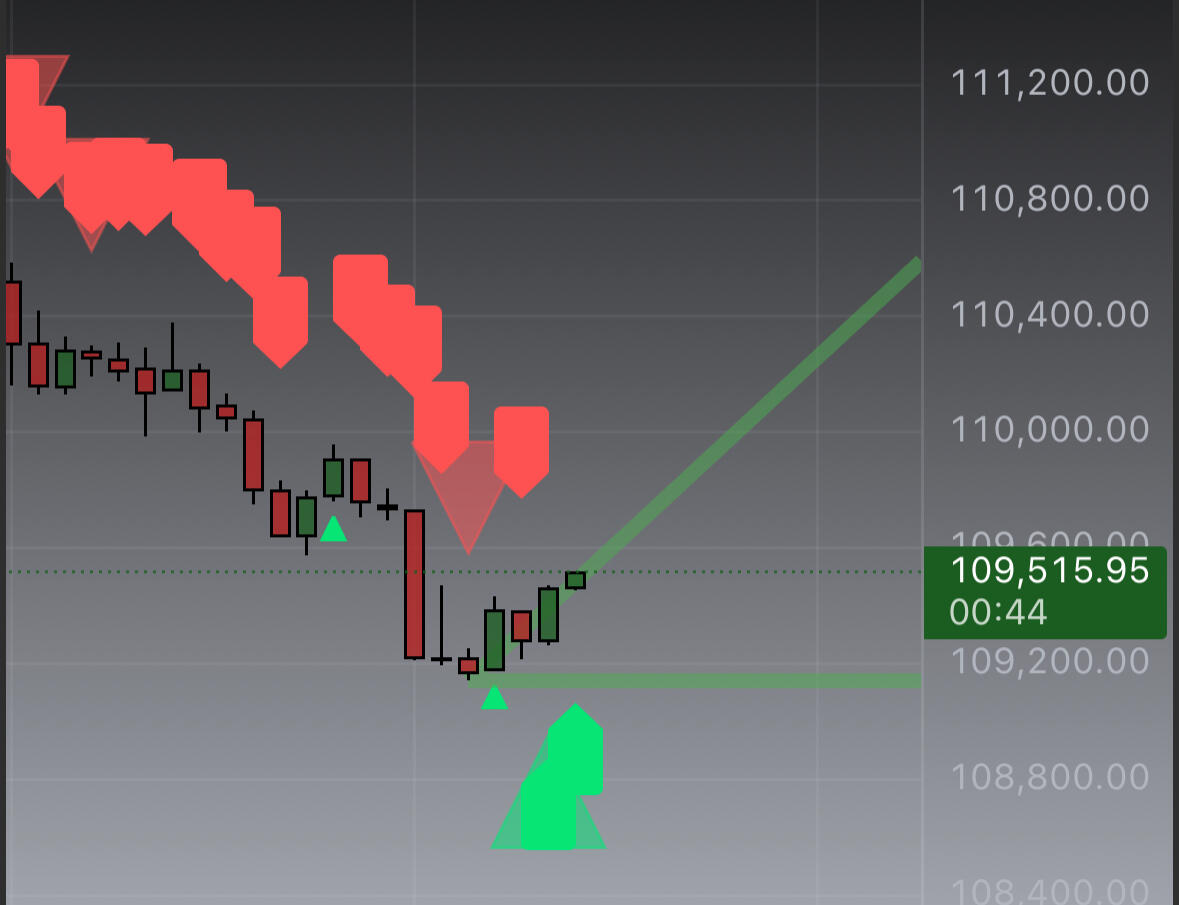
#4
Bull-Bear
Pressure
BULL-BEAR PRESSURE — based on our internal LOGIC data, this indicator provides insights into real-time pressure dynamics.
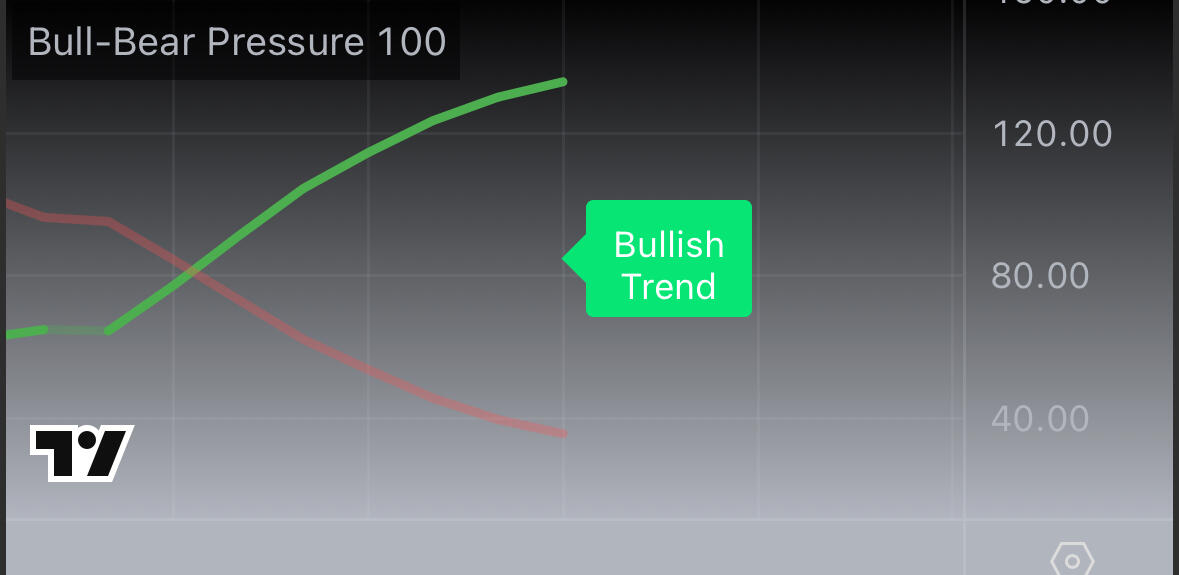
Illustrative only — past performance does not guarantee future results.
#5
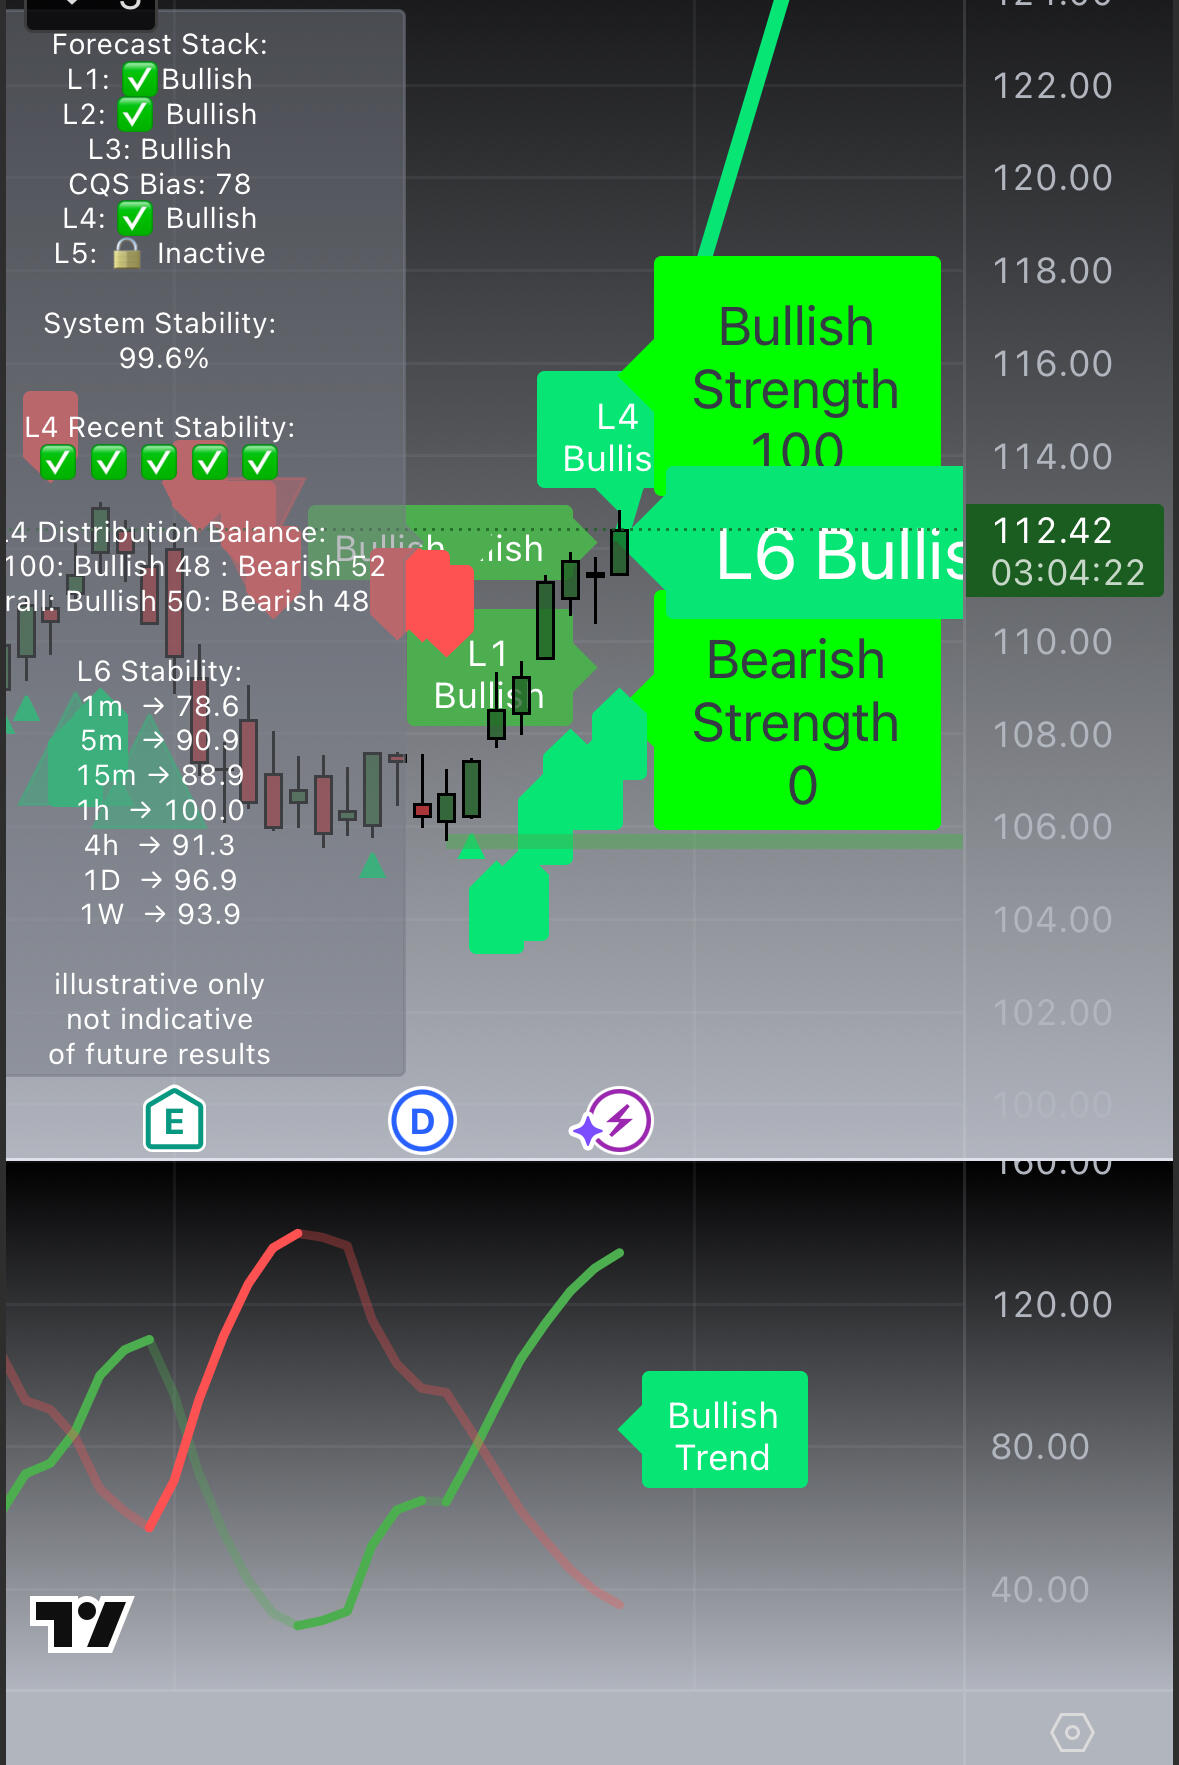
Dashboard
DASHBOARD — The Predator dashboard condenses LOGIC stats into one clean display. It logs recent outcomes and tracks forecast type distribution.
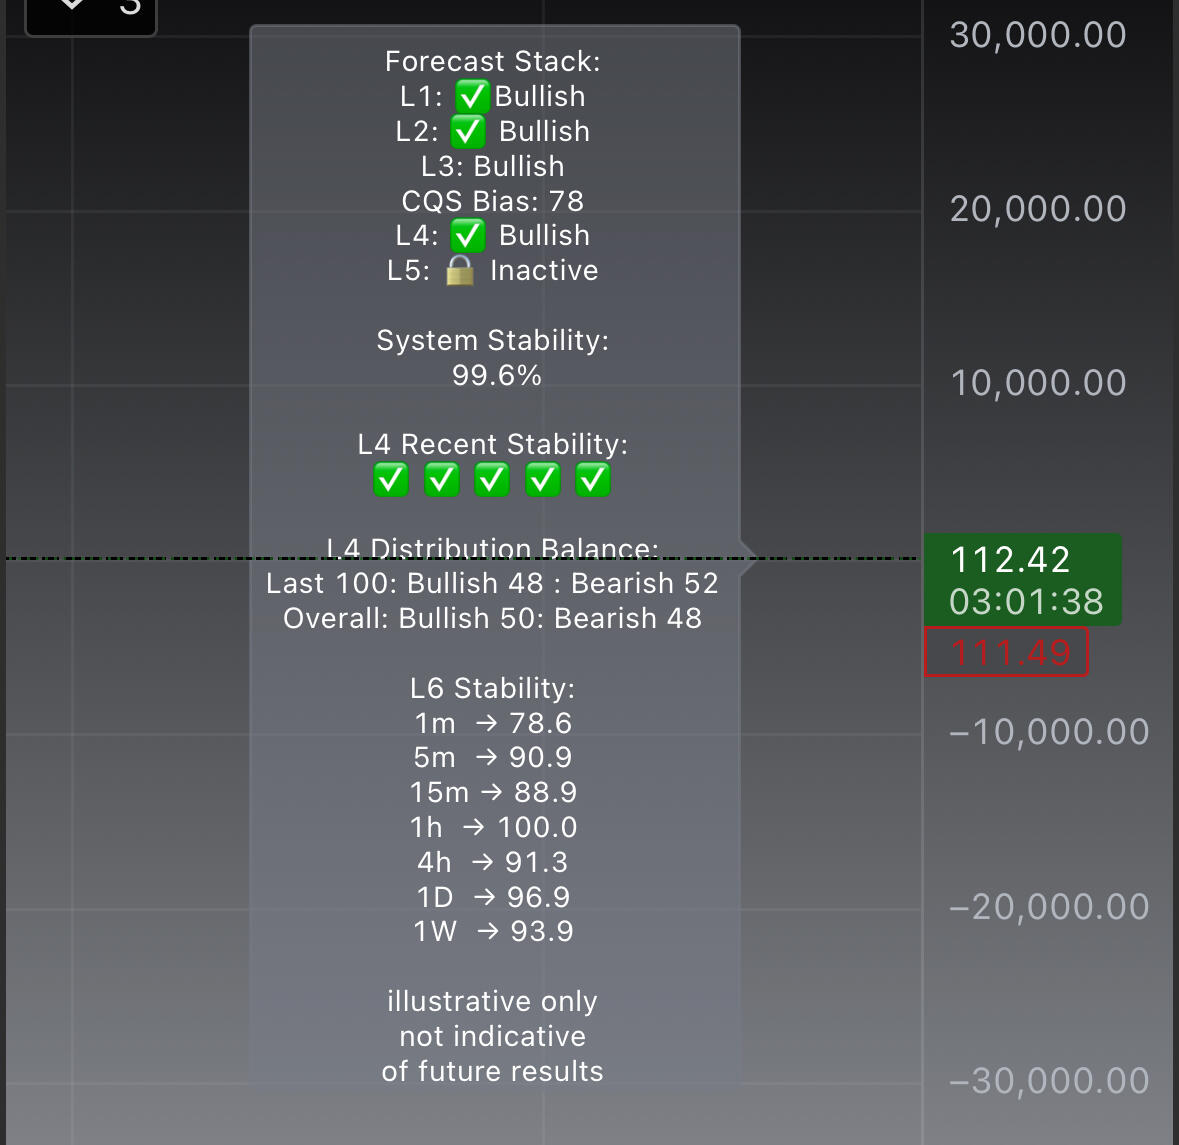
Illustrative only — past performance does not guarantee future results.
What makes Predator Different
Trading is difficult because it’s easy to become overwhelmed with information and indecision. Imagine a screen full of the most popular indicators and still no clear direction, especially when they contradict each other. Many people face the same problem because they're all doing the same thing.RSI, MACD, EMA, CCI, VWAP, QQE, price action, volume, candlestick patterns — they all explain what’s already happened. Financial statements and cash flow can tell you a lot about the health of a company, but they don't tell you about the short-term pressure shifts happening right now.No matter how much you study or how many indicators you combine, or how many financial reports you read, you’re still left asking the same questions:
“Will the next candle go up or down?”
Or worse,”WHY is this candle going down instead of up?!”Gaining a new perspective means applying tools that approach the market from a different angle.
Clean or Chaotic.
Intuition or Indecision.
Illustrative only — past performance does not guarantee future results.
The Staircase
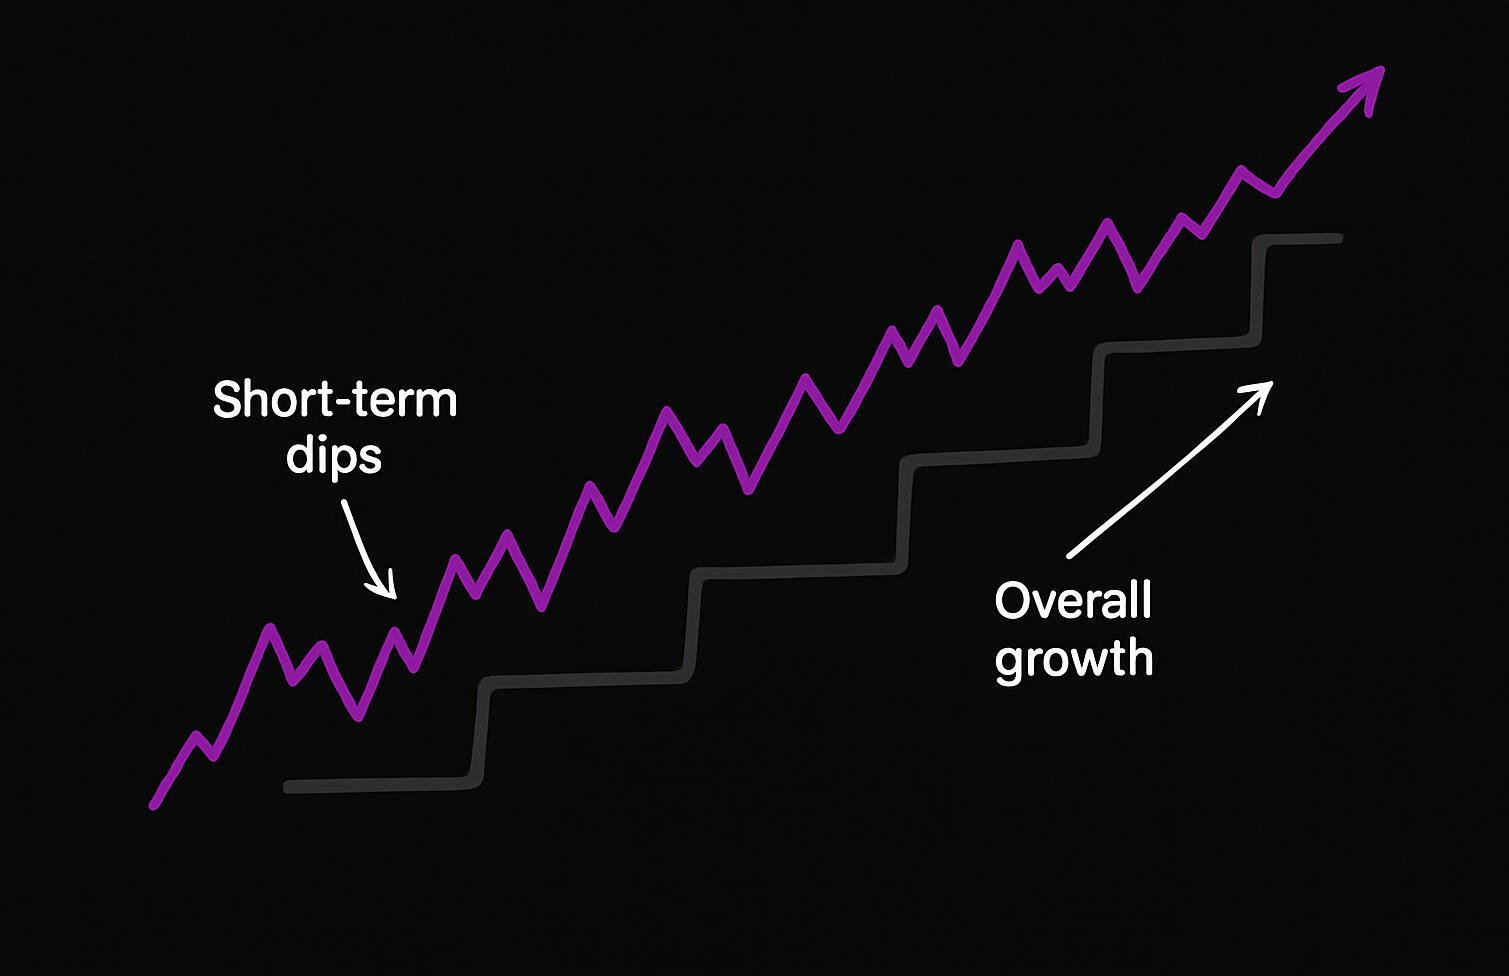
Illustrative example only — past performance does not guarantee future results.
Most people expect a stock that grows 10% in a year to move in a straight upward line. In reality, the path is much less predictable. Prices move up and down along the way, often gaining 2–3% one week and then giving most of it back the next. Despite the back-and-forth movement, the overall direction can still be upward.A useful way to picture this is like a staircase. Instead of flat steps, imagine the edges of the stairs are tilted and uneven. Each step may rise and dip as it goes, but the staircase itself still climbs higher over time.From this perspective, the key idea isn’t to focus on every single small movement, but rather to recognize the overall direction of progress — the tilt of the staircase. Within that larger climb, there are also smaller shifts where momentum slows down or picks back up, creating short stretches that either add to or briefly pause the growth.Understanding this “stair-step” view of the market helps put short-term changes into context. The day-to-day or week-to-week ups and downs are part of the normal process, while the long-term direction is what defines the bigger picture of growth.Predator helps you visualize this concept by highlighting the dominant direction of movement, making it easier to separate short-term noise from the broader trend and see how smaller shifts fit into the bigger momentum picture.
Live
Forecasts
We don’t guess — our system applies statistical analysis to identify and display conditions in real time, giving you a different perspective.
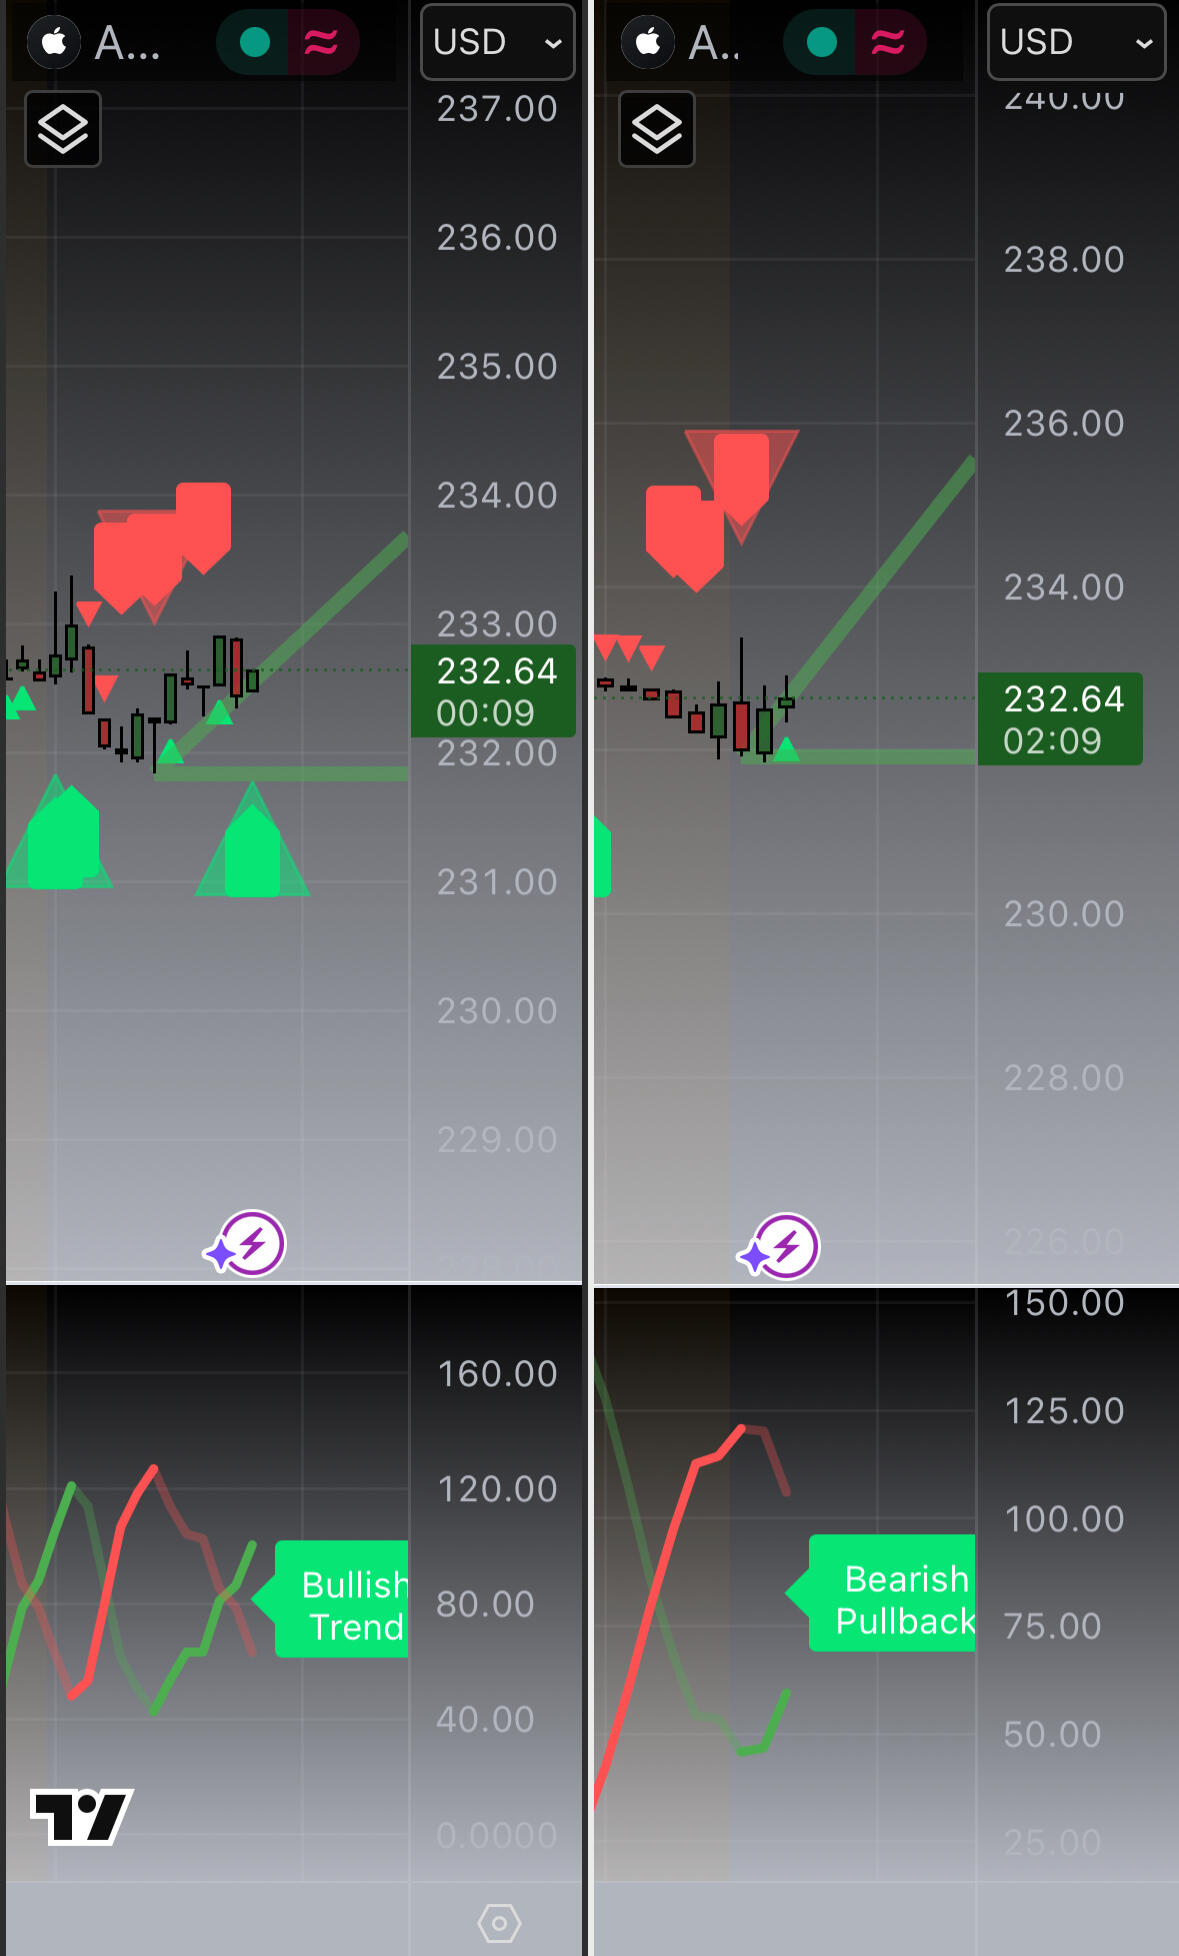
Apple 4HR chart
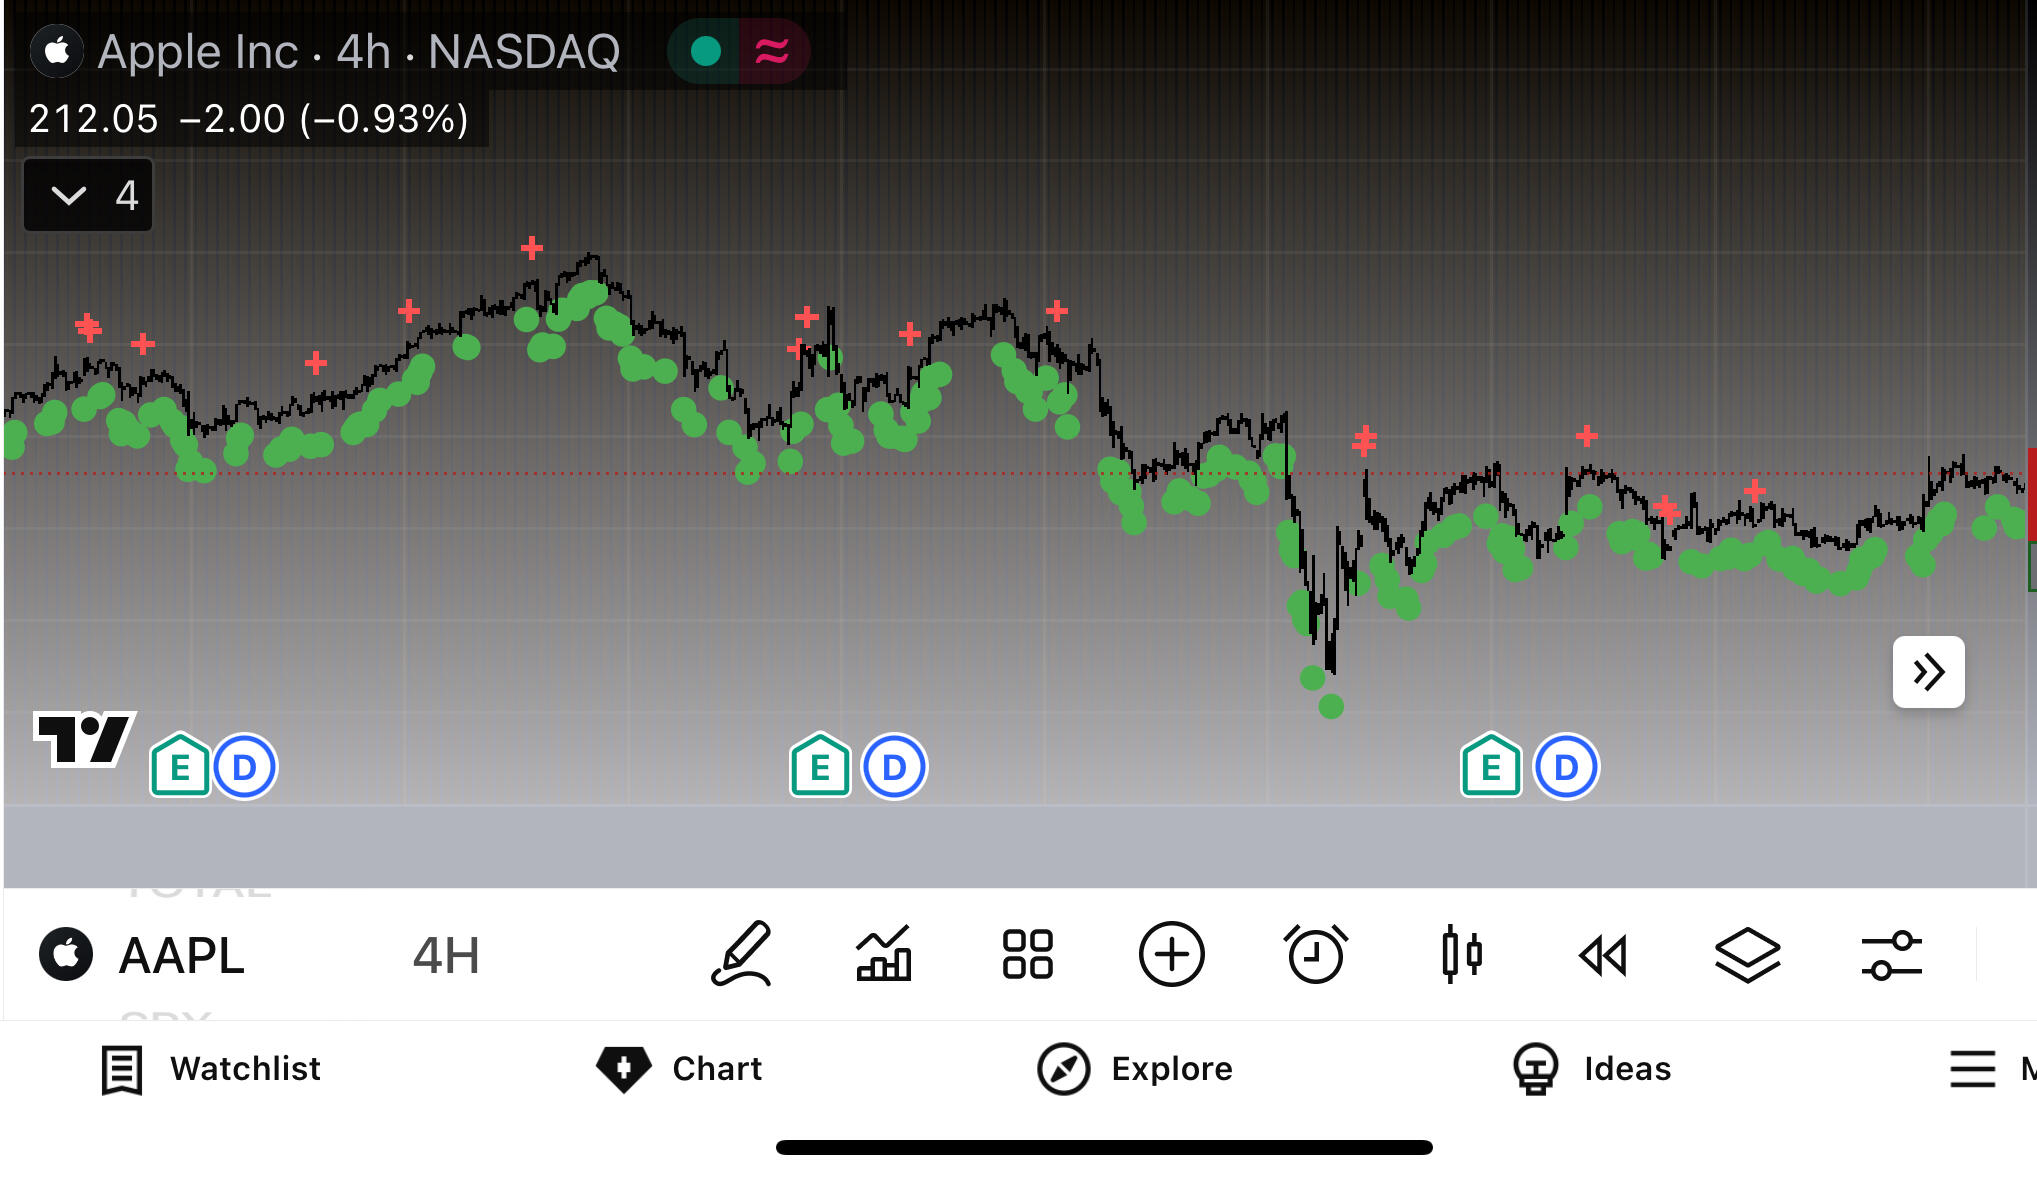
Illustrative only — past performance does not guarantee future results.
Green dots represent past forecasts that matched candle direction at close, while red crosses mark those that did not. These are displayed as they occurred — without adjustment.
eur/USD 4HR chart
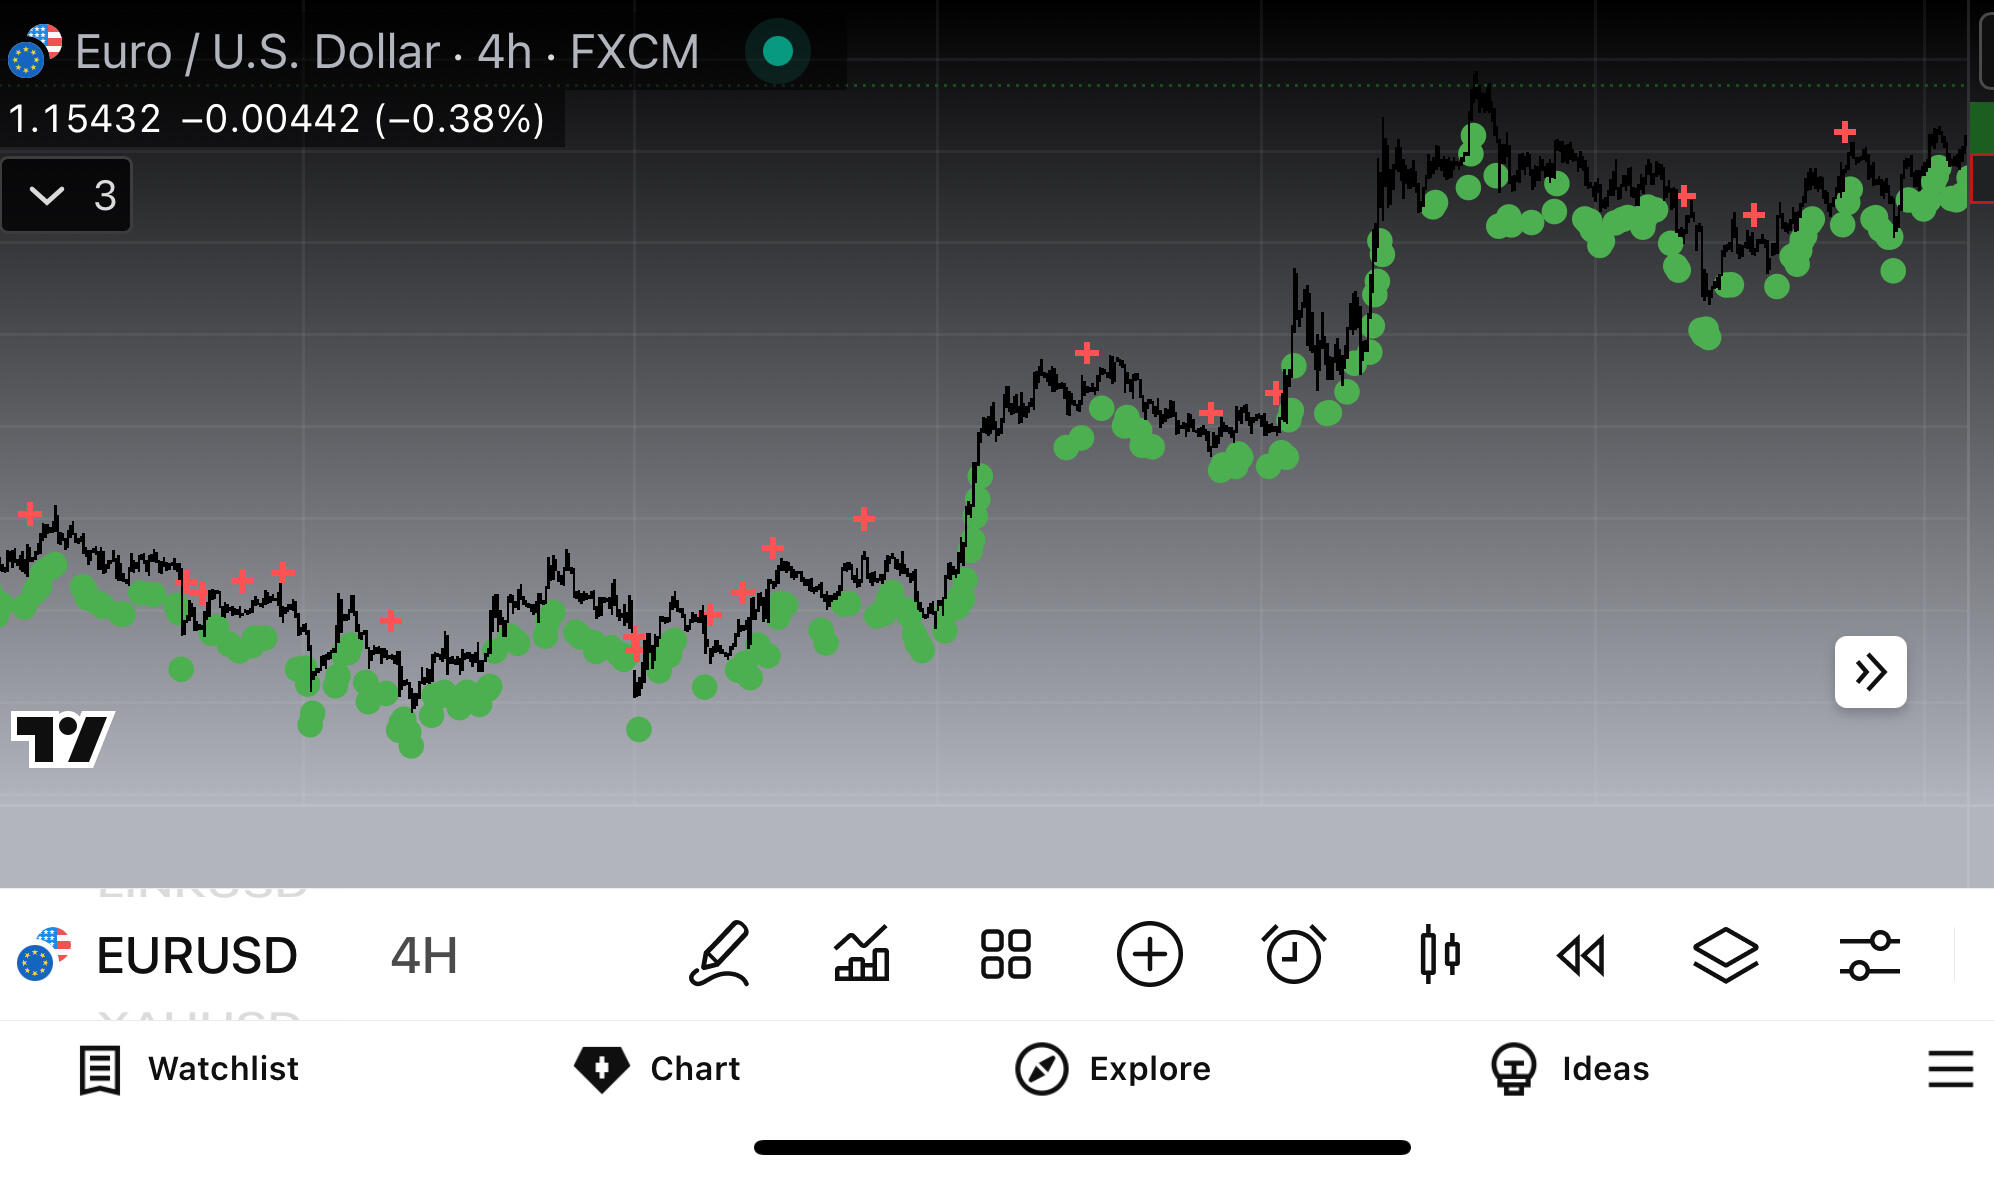
Illustrative only — past performance does not guarantee future results.
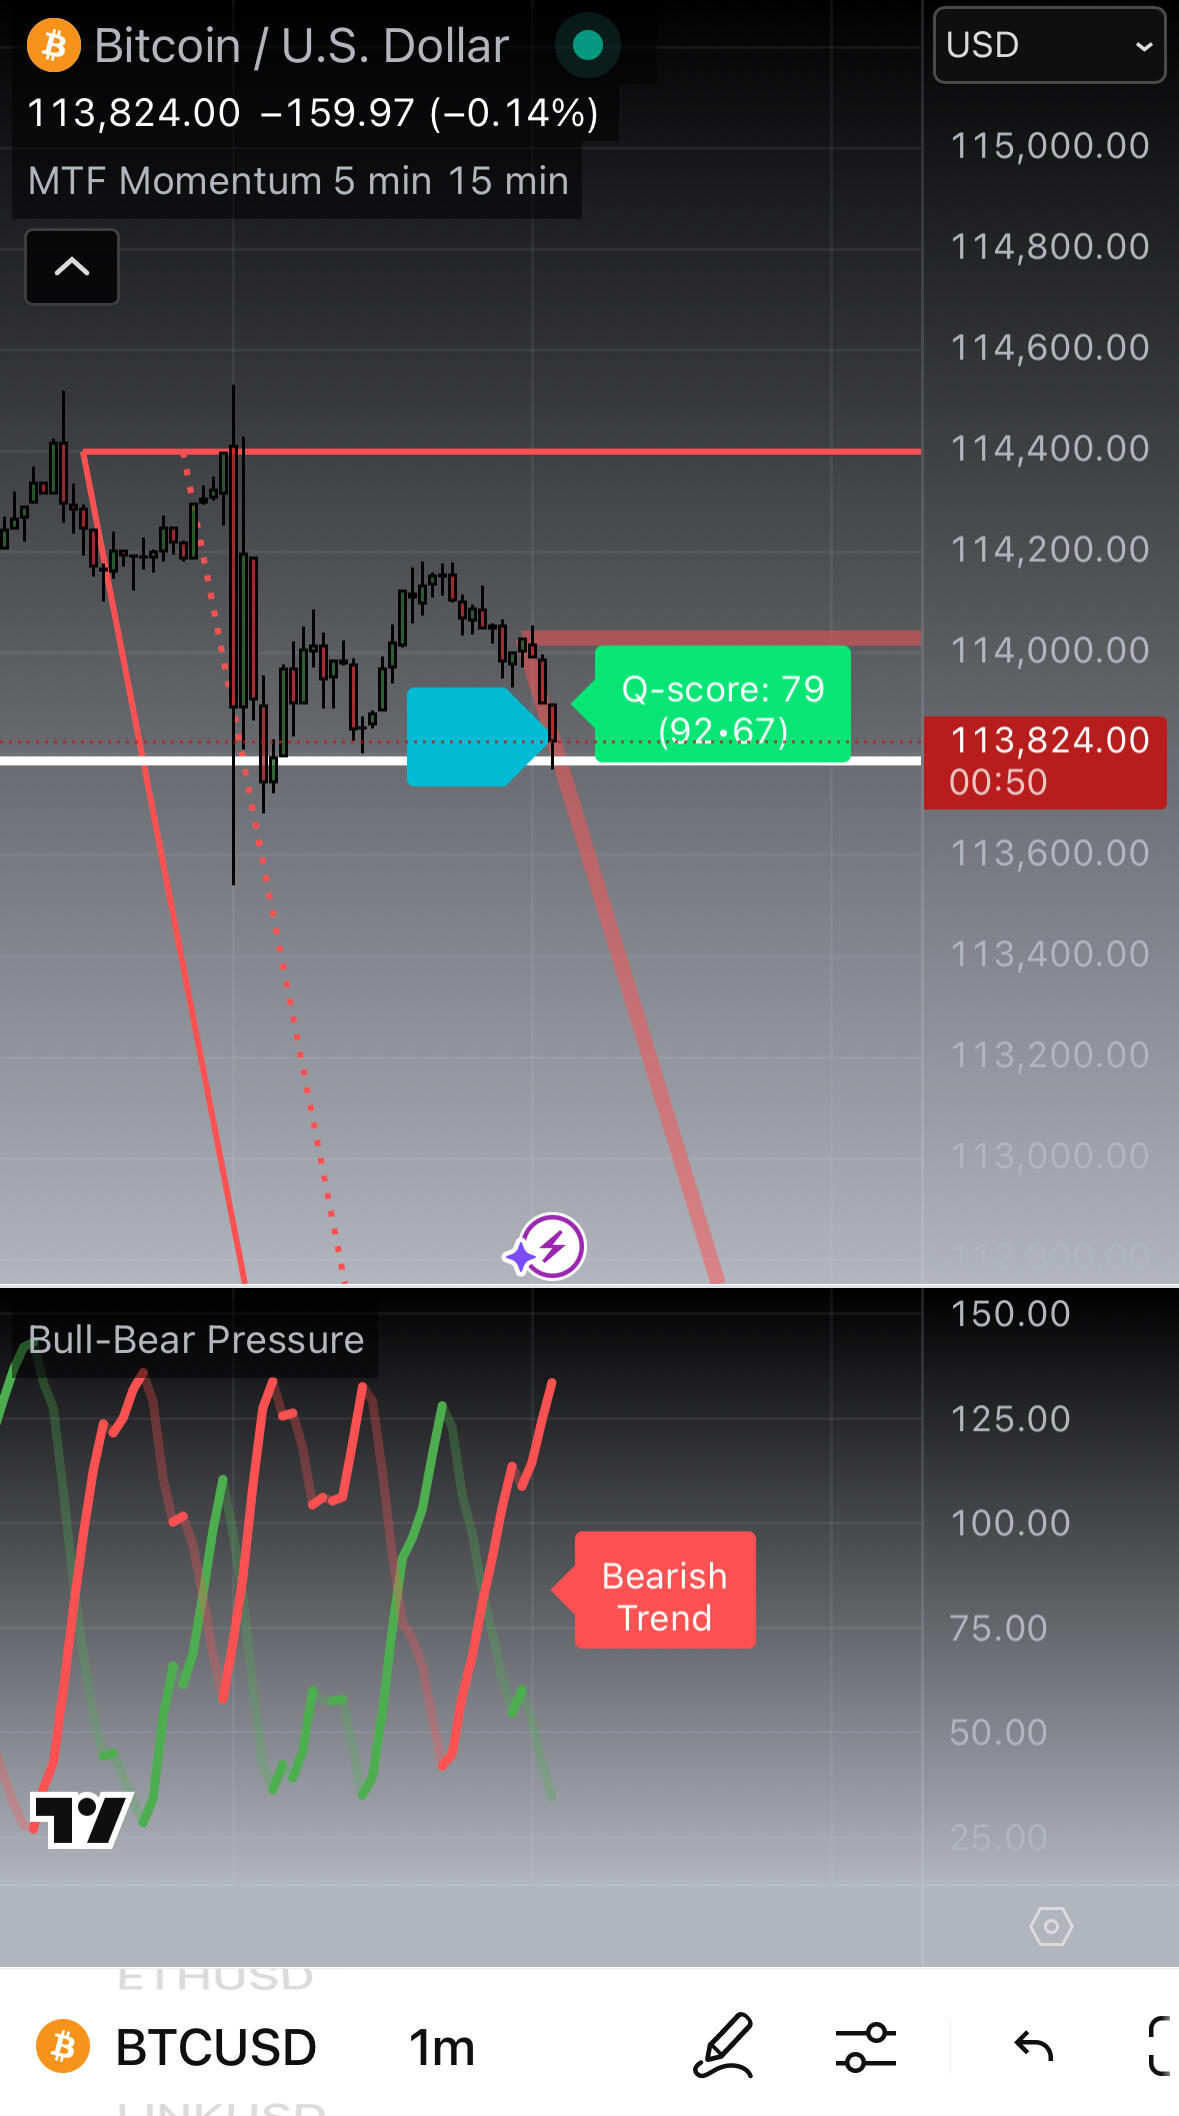
Bitcoin 4HR chart
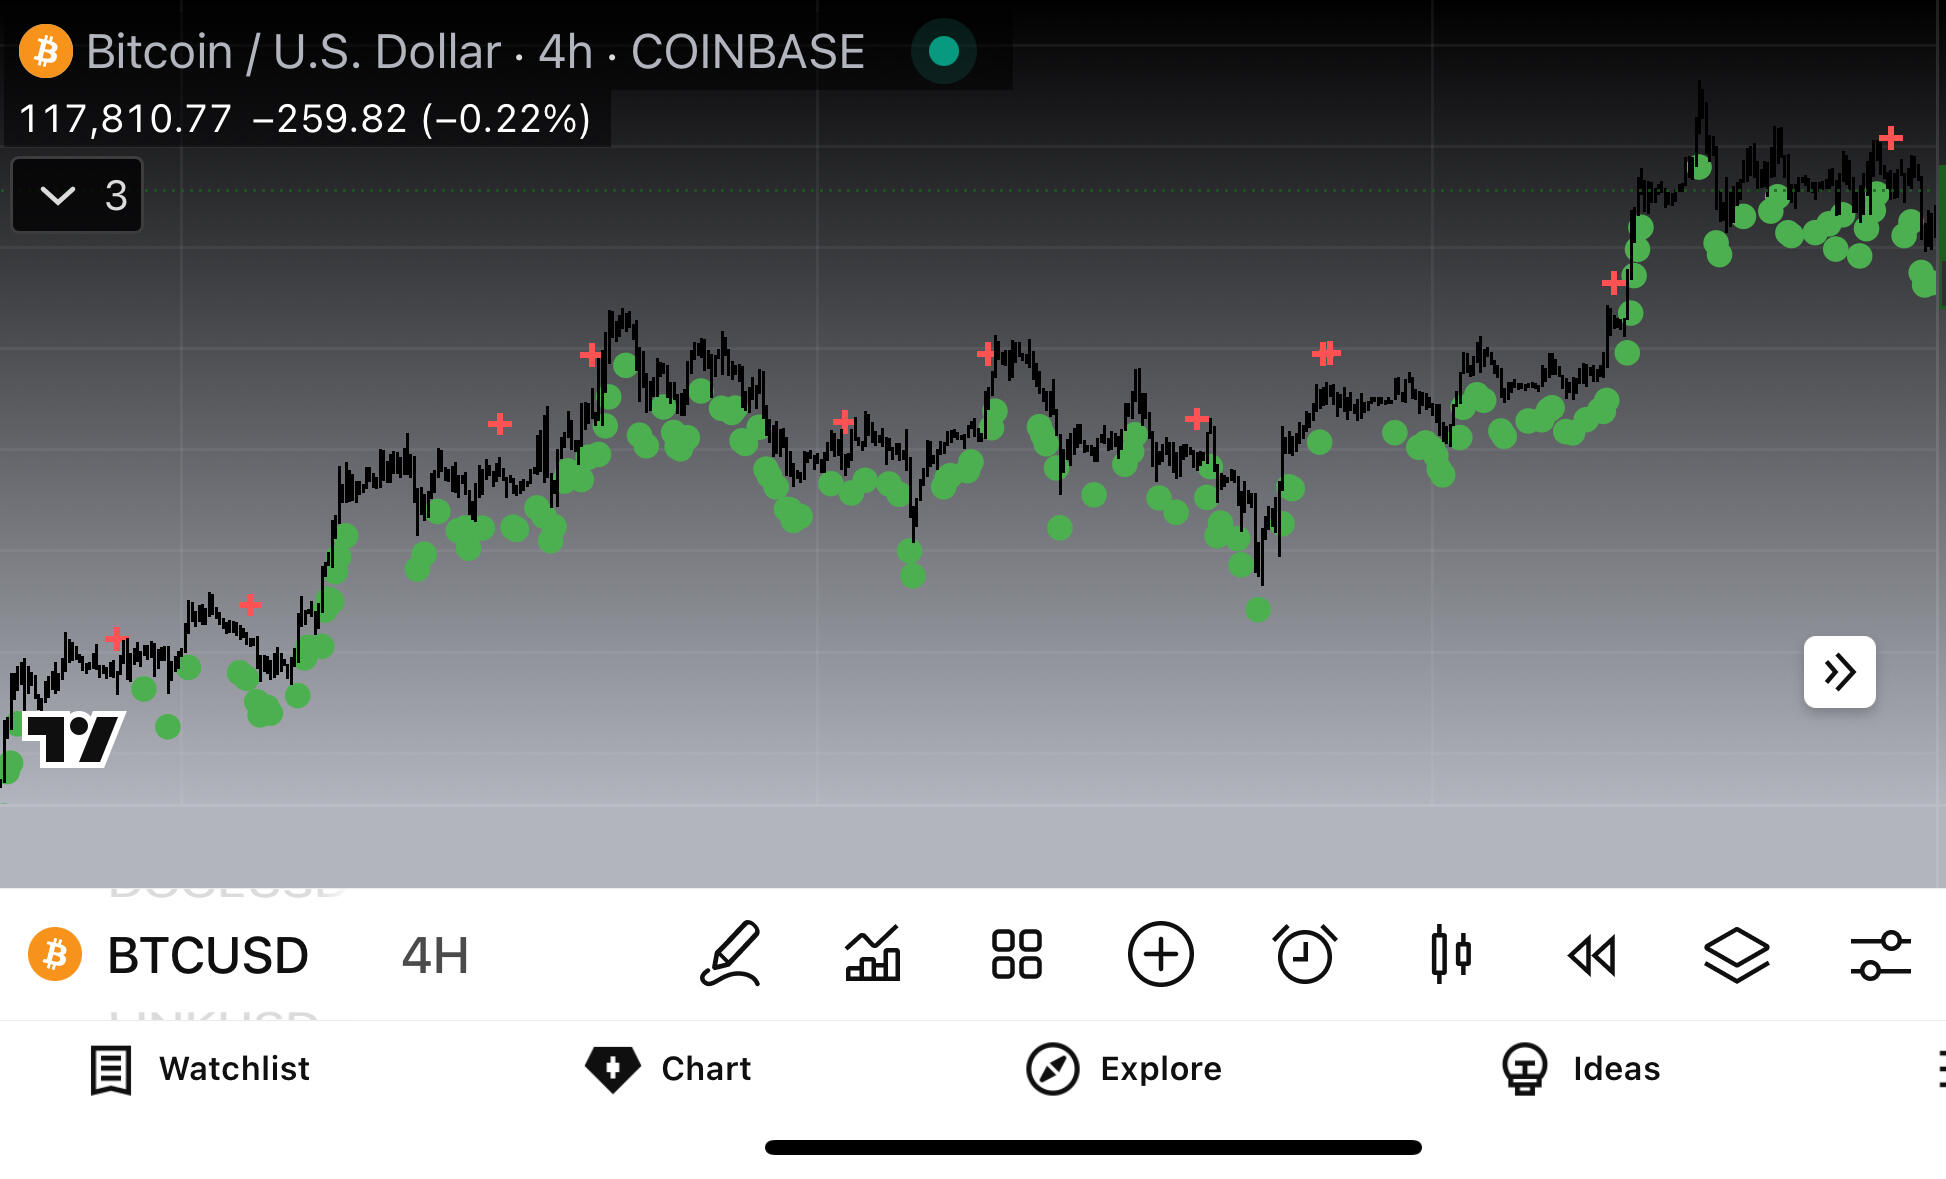
Illustrative only — past performance does not guarantee future results.
How Predator Is Designed
We’re not guessing — we’re applying statistical analysis to highlight candles that may reflect active momentum as it develops.While traditional tools show where momentum was strongest, Predator focuses on the present:
Is momentum active right now?
Illustrative only — past performance does not guarantee future results.
Predator is based on a proprietary multi-engine model that processes data in real time. The system is intended for experienced retail traders — especially those in short-term and options markets — who are familiar with conventional indicators and are interested in viewing market conditions from a new, different perspective.
Illustrative only — past performance does not guarantee future results.
The Reality of Trading:
Small moves are part of the trading process. Instead of seeking oversized returns, experienced traders often emphasize risk management, consistency, and staying engaged over time.
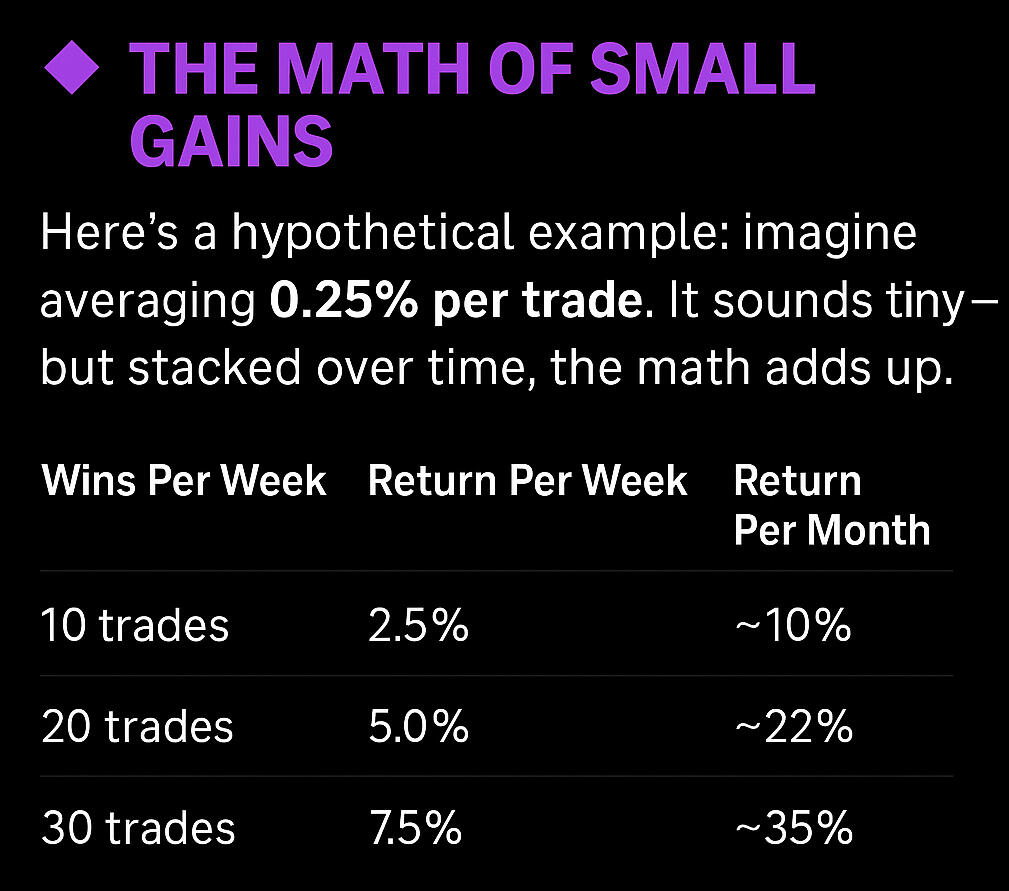
This is a simple arithmetic example of compounding math. It does not represent actual trading performance or expected outcomes.
Illustrative Example #1:
Here’s a 6-minute scalp illustration on MicroStrategy (MSTR) using 1-min charts. The chart highlights a small sample move (+0.36%) between entry and exit.This is a historical chart illustration, not a guarantee of results. Any references to % moves are examples of math applied to past price action and do not represent future outcomes.
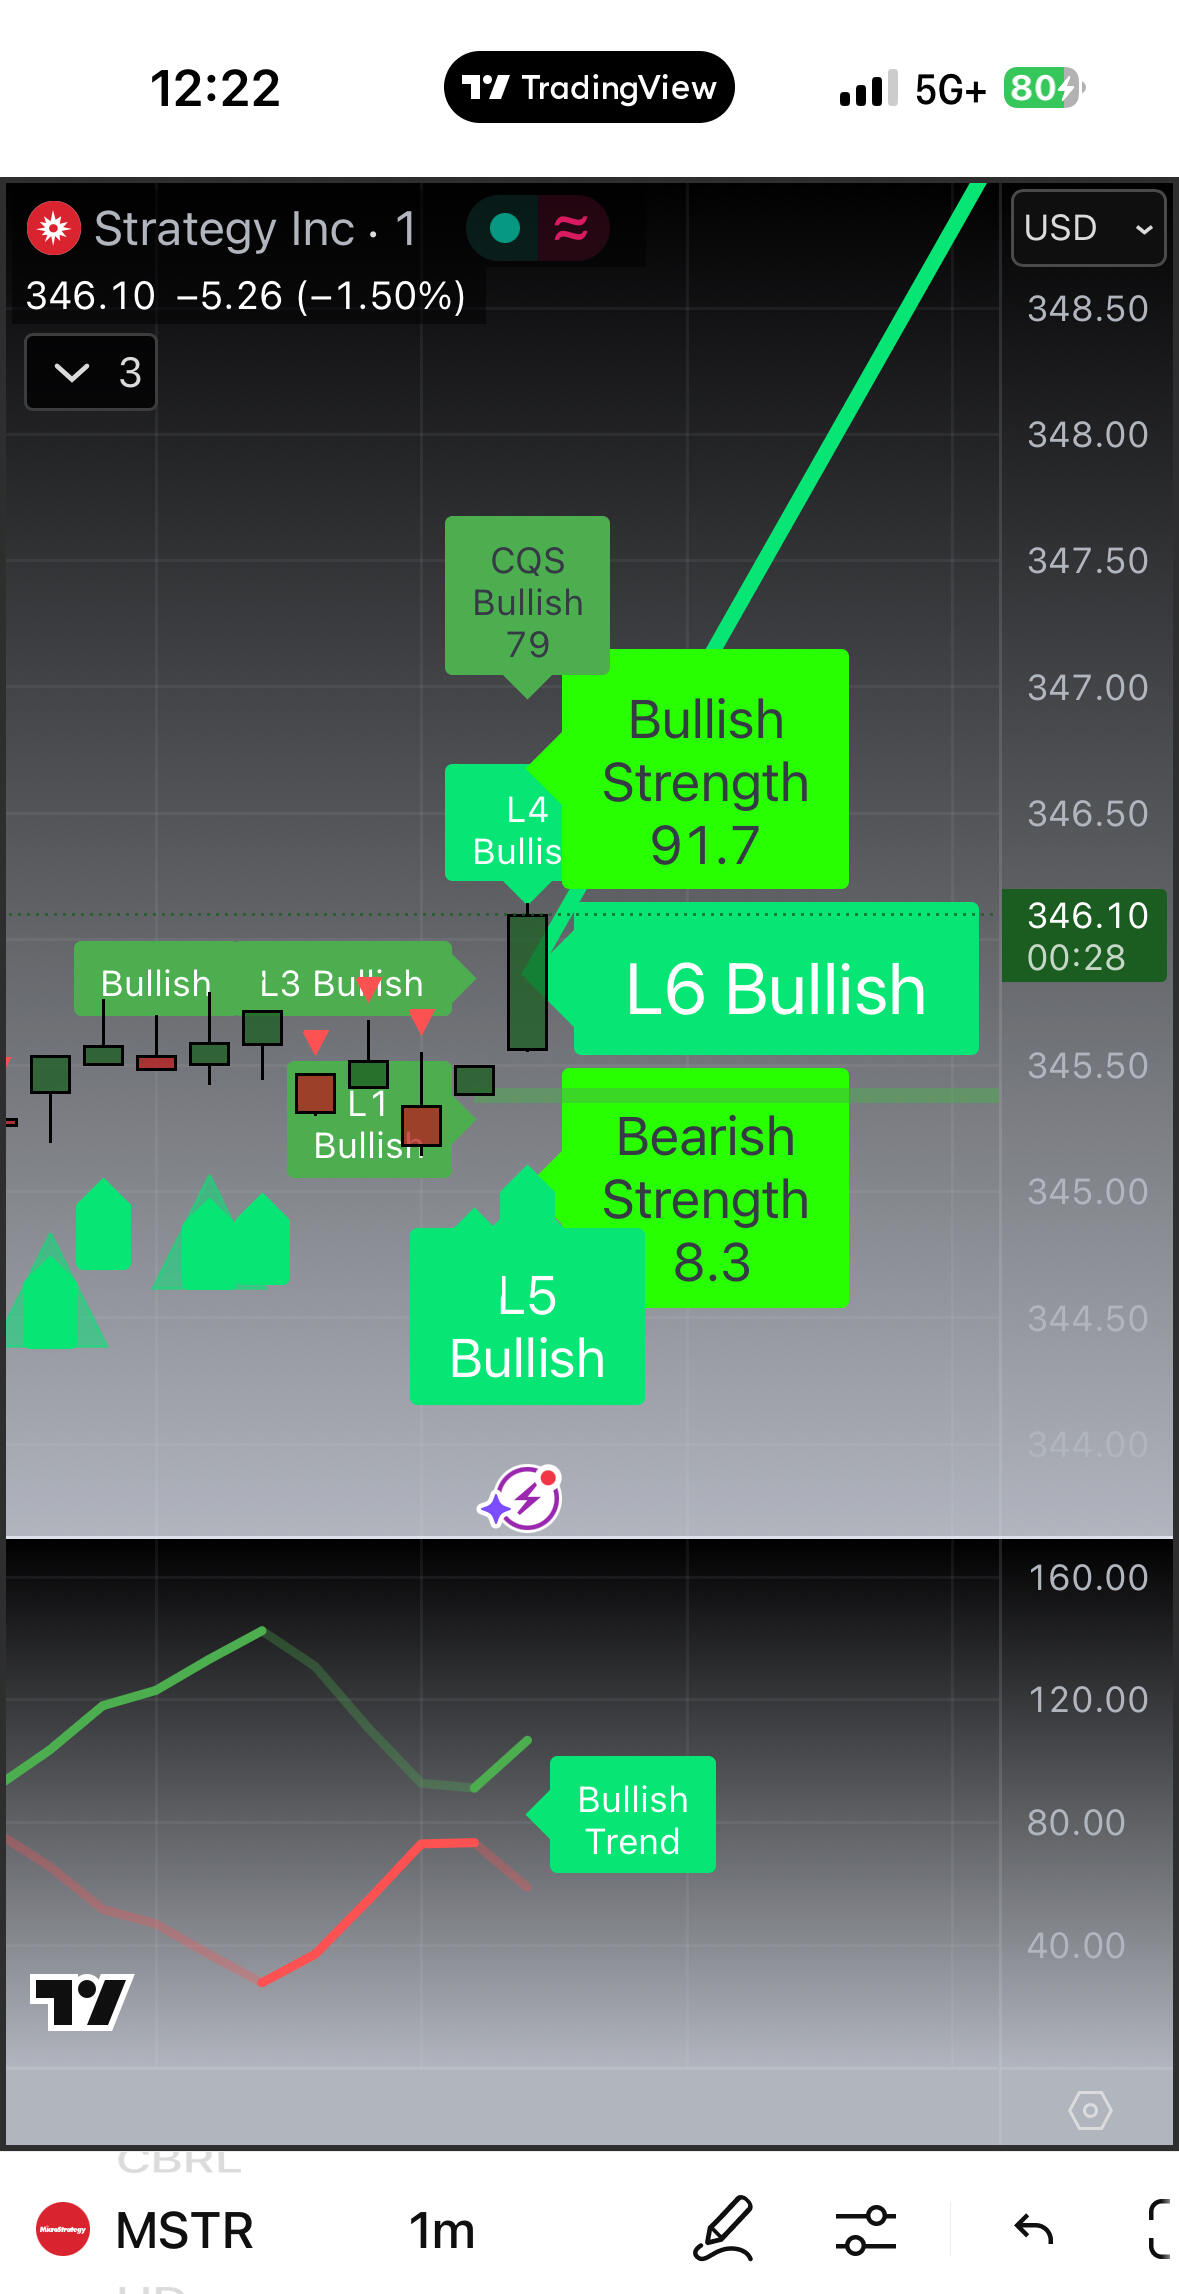
Illustrative only — past performance does not guarantee future results.
6 minutes later…
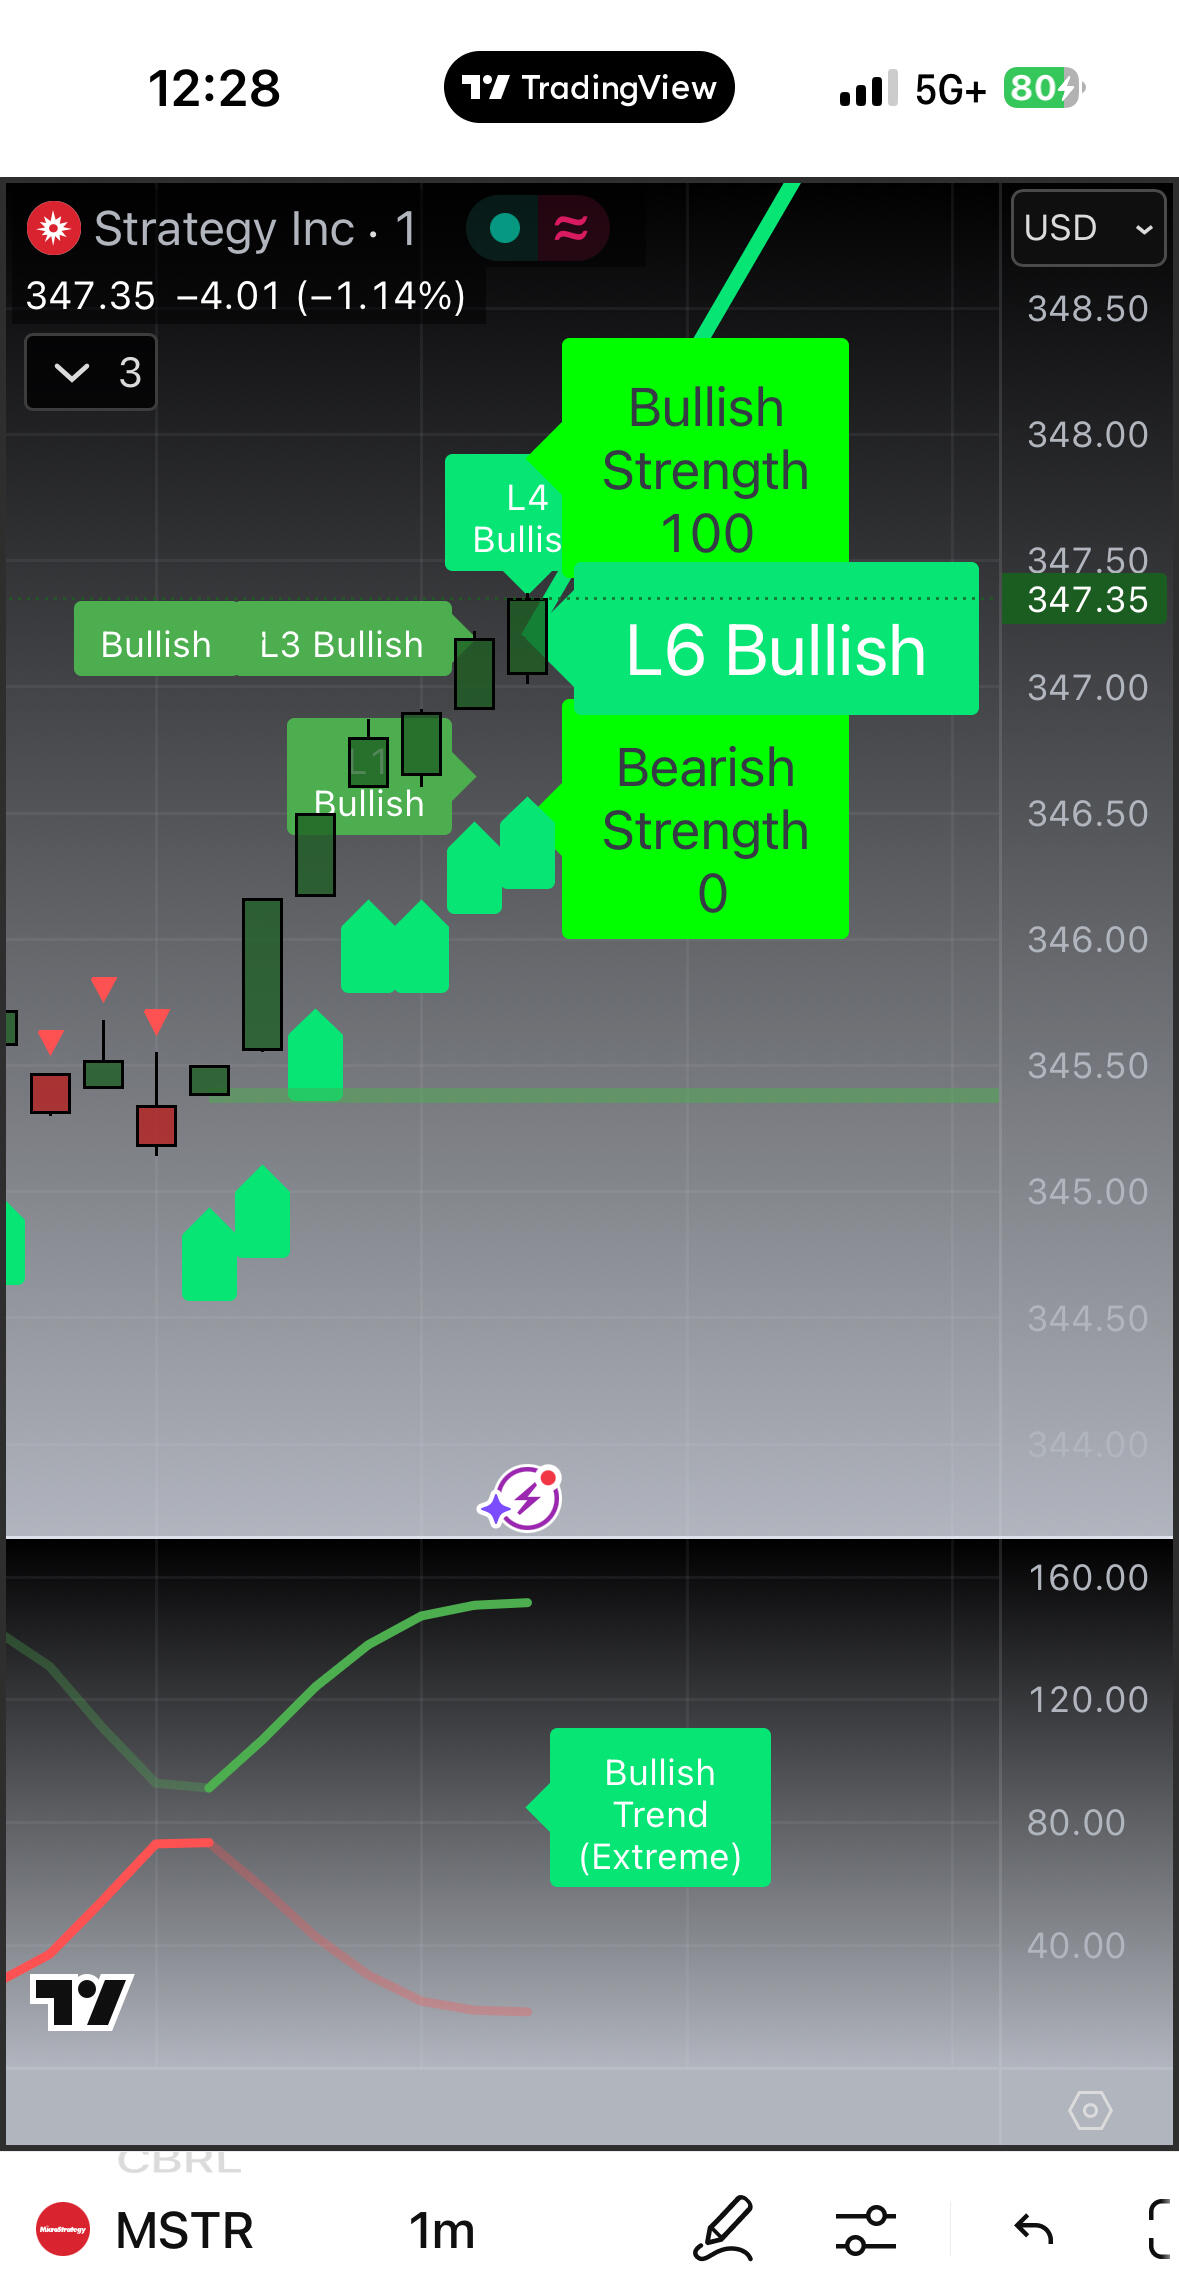
Illustrative only — past performance does not guarantee future results.
Illustrative Example #2:
Here’s a 16-hour trade illustration on Chainlink (LINKUSD) using 4-hour charts. The chart highlights a sample move (+2.55%) between entry and exit.This is a historical chart illustration, not a guarantee of results. Any references to % moves are examples of math applied to past price action and do not represent future outcomes.
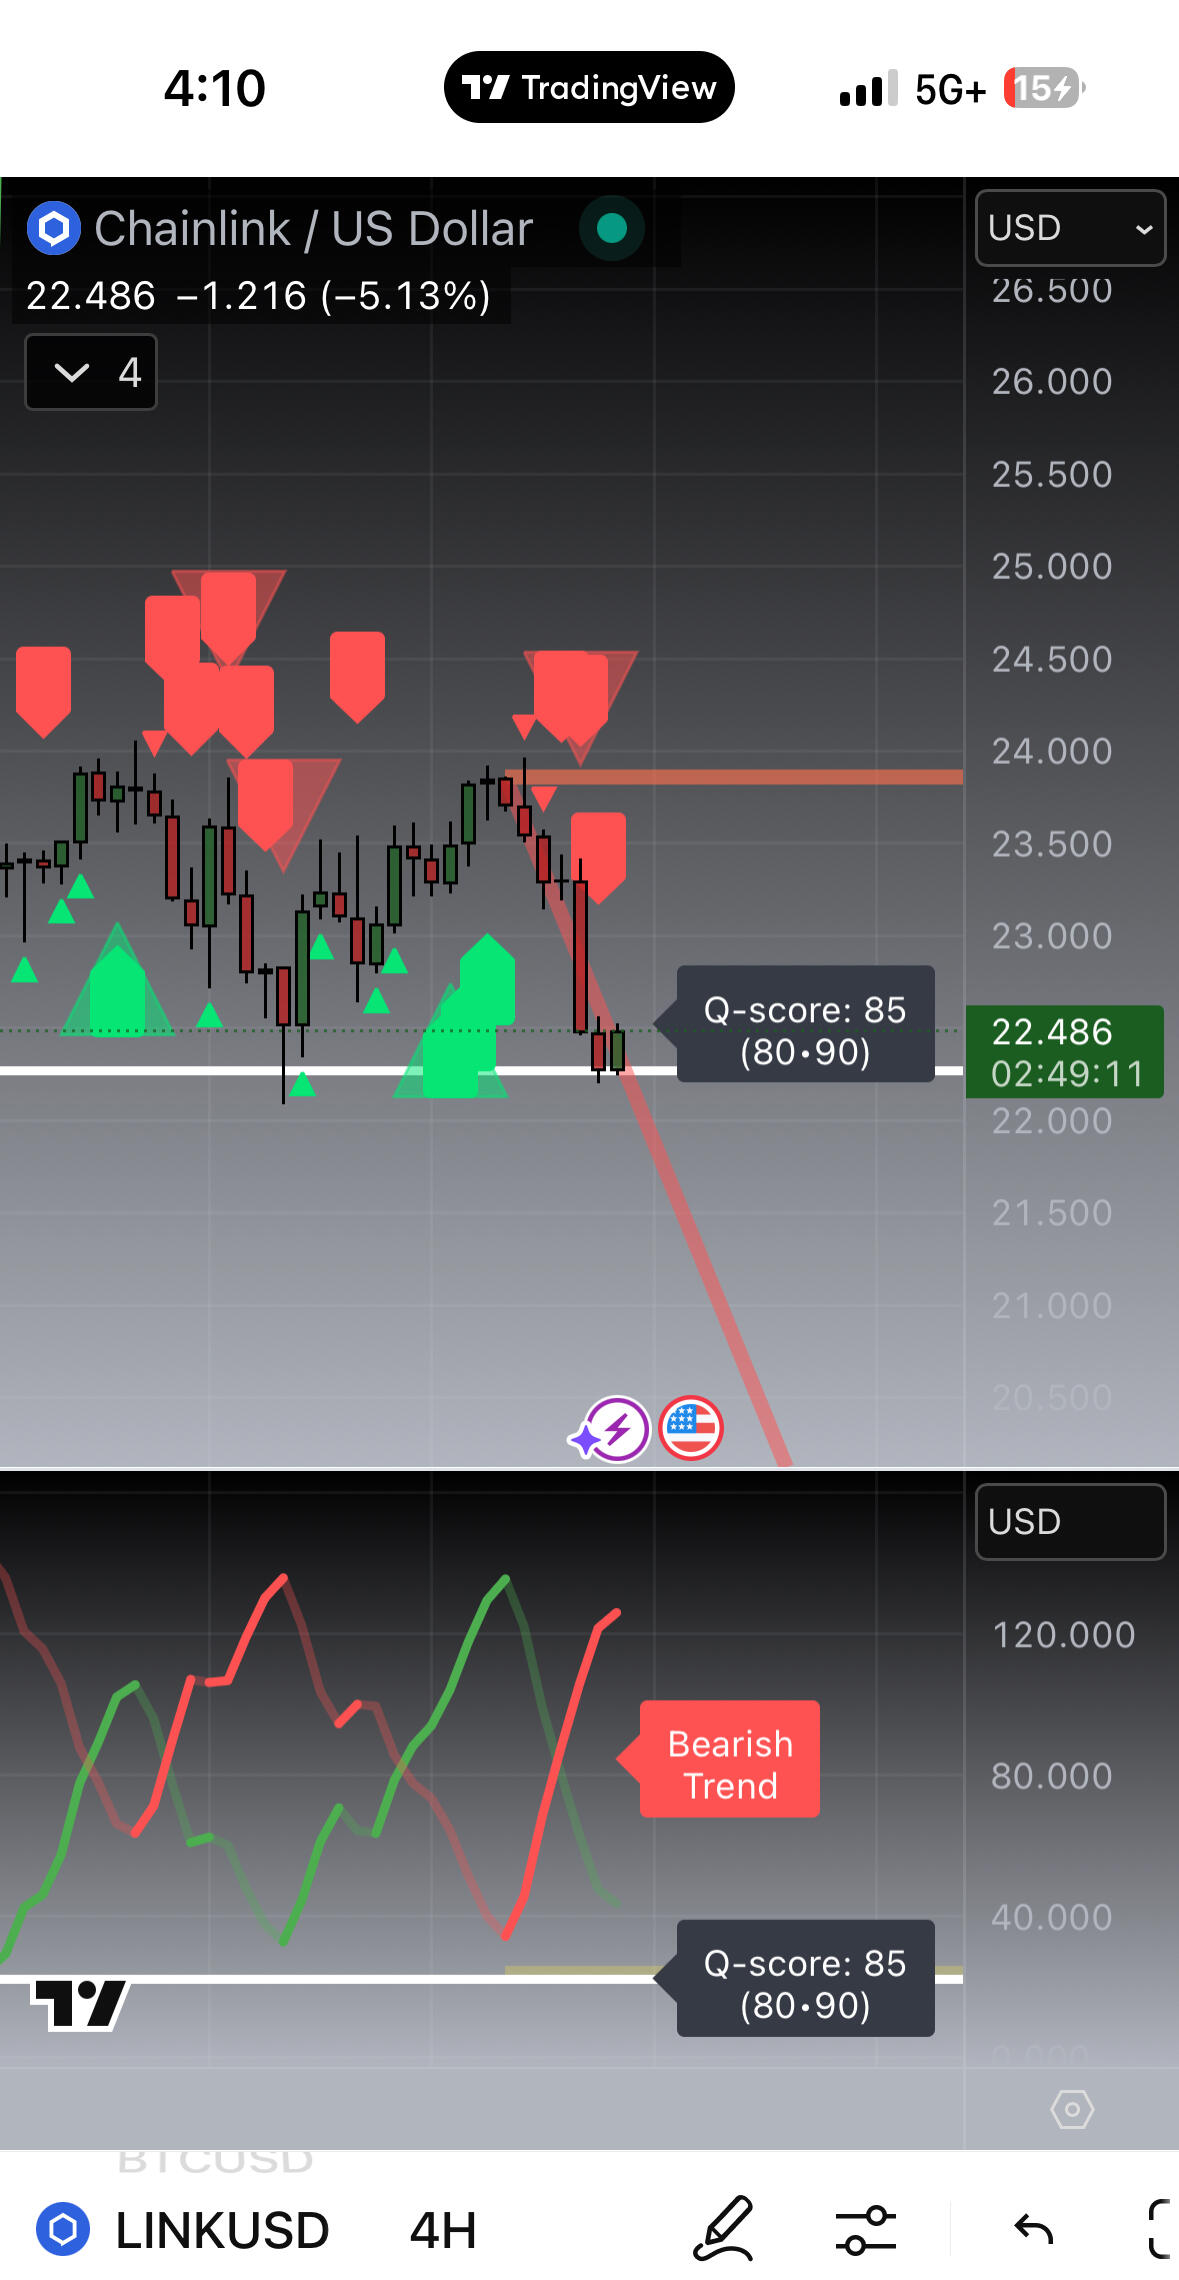
Illustrative only — past performance does not guarantee future results.
16 hours later…

Illustrative only — past performance does not guarantee future results.
$9.95/week after the
7-day trial unless
cancelled.
Cancel anytime.
A Note on Performance, Risk, and TransparencyEvery trade is different. Every trader is different. Everyone has unique goals and risk tolerances. The examples shown are for illustration only — they demonstrate how small moves and controlled losses can be part of a broader trading process.We do not guarantee performance or success, and we do not provide financial advice. Trading is inherently risky, and you may lose some or all of your investment. These tools are intended for educational and informational purposes only.We do our best to be as transparent and honest as possible. Our goal is to build long-term relationships with customers.How we define Accuracy:
• Correct = Prediction aligned with candle direction at close
• Wrong = Prediction did not align with candle direction at close
• Neutral = No forecast, or weak forecastThis accuracy definition is for illustration and internal measurement purposes only. It does not represent guaranteed performance or trading results.We track and display every forecast— not just the ones that aligned.Our forecasts are not repainted.
Once a candle closes, the forecast is recorded and remains visible. It does not disappear, change, or adjust after the fact. This approach ensures transparency and consistency.But What About Forecasts That Change Mid-Candle?
Yes — forecasts on the current open candle may shift intrabar (during the candle). That’s because Predator is designed to update in real time as new price data comes in.This is forecasting, not repainting.
Repainting means going back and altering the past. Forecasts update intrabar and lock at bar close; they are not adjusted after the fact.Why This Matters:
Non-repainting means forecasts remain visible after they appear.This provides a consistent historical record, giving traders transparency in reviewing past forecasts.Real-Time Forecasting = Real-Time Updates
The fact that Predator can adjust its forecast during an open candle is a feature, not a flaw. It means the system updates continuously as new price data comes in, reflecting changing market conditions until the candle closes.This framework is for internal measurement and illustrative purposes only. It does not predict or guarantee future accuracy.
Context
Matters
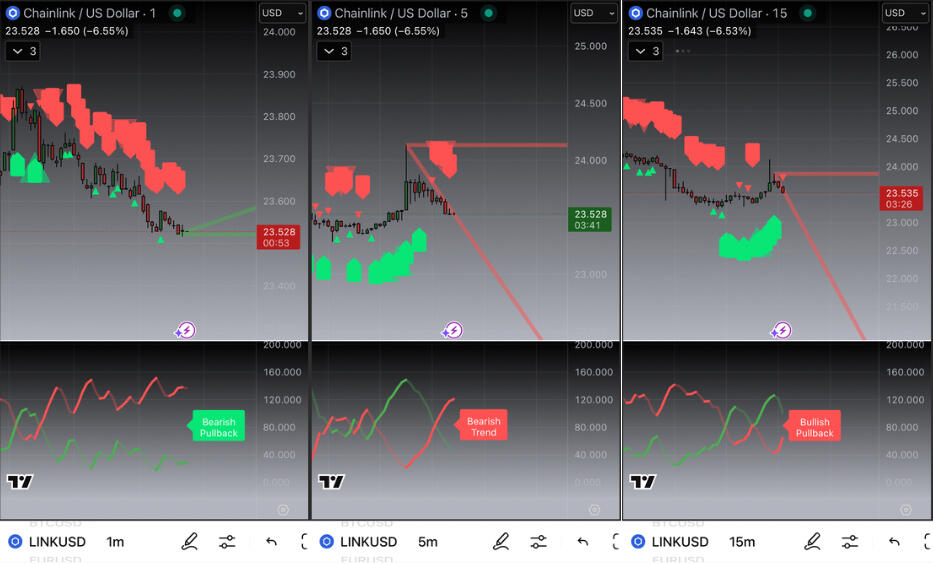
With upgraded TradingView accounts you can have multiple charts open next to each at the same time.
This multi-dimensional view may help provide context to individual timeframes so you can make more informed decisions.
Illustrative example only — past performance does not guarantee future results.
Illustrative simulated example only — past performance does not guarantee future results.
Flexibility
This isn’t just a set of tools. It’s a trading system built with flexibility in mind.You’re in control of how you use it. Whether your focus is long-term positioning, shorter-term opportunities, or simply learning to see market conditions from a different angle — the system adapts to your style.We provide the data, structure, and clarity. How you apply it depends on your own goals, risk tolerance, and approach.Our advice: Start small. Learn the system. Get comfortable before scaling. This isn’t about quick wins — it’s about building a process you can understand and refine.Trading involves risk, and outcomes will vary — this system is intended to support decision-making, not replace it.
limited to 500 members.
Then by invitation only
Once we reach 500 active subscribers, Predator Trading Systems will move to an invite-only model. No public access.Why? Because this isn’t about volume — it’s about focus and maintaining quality, stability, and support for members. The system is designed for disciplined traders who value structure and transparency.• TradingView has over 50 million registered users — about 1 in every 150 people on Earth.
• More than 2 million traders log in daily.
• Worldwide, there are over 100 million individual traders.500 seats out of 50 million?
That’s 0.001% access — just 1 in 100,000 traders.

Get New Updates as They Roll Out!
One Membership
All Access!
Future indicators, AI-powered upgrades, and new feature drops are automatically included with your active membership.
$9.95/week after the
7-day trial unless
cancelled.
Cancel anytime.
Free
24 Hour
Trial!
We offer a 24-hour free trial because transparency matters.Many trading tools don’t provide open trials. Predator takes a different approach:
• See it in action. Watch the system plot forecasts in real time.
• Full visibility. Every forecast is displayed on the chart — whether it aligns or not.
• Trial as proof. A single day on live charts is enough to understand how it functions and decide if it suits your approach.What the free trial provides:
• Filters for those genuinely interested.
• First-hand experience with the workflow.
• Builds trust by showing everything directly.Bottom line:
We offer a straightforward opportunity to see Predator in action and let you decide if it fits your trading process.
$9.95/week after the
7-day trial unless
cancelled.
Cancel anytime.
What do I need to get started?
If you already use TradingView, you’re ready to go. If not, you can download it for free here.To display more than two indicators on screen at once, TradingView requires at least an Essential-level membership. TradingView may offer a free trial for paid plans — check their site for current details.Once you’re set up, the next step is access to our suite of 5 real-time indicators, designed to provide transparency and new perspectives on market conditions.Tool 1: LOGIC — the core indicator that displays real-time intrabar forecast updates.Tool 2: FORECASTS — information gathered from LOGIC distilled into a few simple forecast markers that are locked when the bar closes — no repainting, no adjustments afterward. Also has contextual self-adjusting support and resistance levels.Tool 3: MTF MOMENTUM — With the MTF Momentum Indicator, you can view multiple dimensions of market behavior in a single interface. By combining different analytical layers into one streamlined tool, it offers context and perspective without the clutter of juggling multiple indicators.Tool 4: BULL-BEAR PRESSURE — dual data feeds that visualize pressure dynamics between buyers and sellers.Tool 5: DASHBOARD — a multi-timeframe confluence meter that condenses LOGIC stats into one clean display.
⸻Use LOGIC for intrabar candle-by-candle action.
Use FORECASTS for LOGIC summary and support/resistance levels.
Use MTF MOMENTUM as your primary indicator.
Use BULL-BEAR PRESSURE for context on pressure dynamics.
Use DASHBOARD to monitor how the system is behaving.Together, these indicators update in real time, giving you transparency into how conditions are developing.Once you complete signup and your trial is confirmed, you’ll receive invitation-only access and your 24-hour evaluation begins.⸻STEP 1: Click “Start Trial”
STEP 2: Connect your TradingView account
STEP 3: Unlock 24-hour Access to Predator Suite
STEP 4: Observe real-time updates — candle by candle
Overwhelmed?
Trying to decode and apply 5 new indicators at once can definitely be challenging. To simplify and make the experience as enjoyable as possible, the only indicators you need to get started are MTF MOMENTUM and BULL-BEAR PRESSURE. You can add FORECASTS once you get comfortable. These 3 comprise your main setup, especially for mobile devices where space is limited. Later you can check DASHBOARD as often as you choose and and see LOGIC update in real-time.If you think about it like driving a car, the new MTF Momentum indicator is like the speedometer, Bull-Bear Pressure is like the fuel gauge, and Forecasts is like the RPM gauge. Think of watching LOGIC as opening the hood and watching the engine run and Dashboard as the rest of the dashboard of your car. Our system can be handled the way most people drive, which is they just watch how fast they’re going and whether they have enough fuel.
Example Simplified Setup
Illustrative example only — past performance does not guarantee future results.
$9.95/week after the
7-day trial unless
cancelled.
Cancel anytime.
Remember — trial spots are limited, and once they’re gone, Predator access moves to invitation-only.We do not execute trades or provide investment advice.